
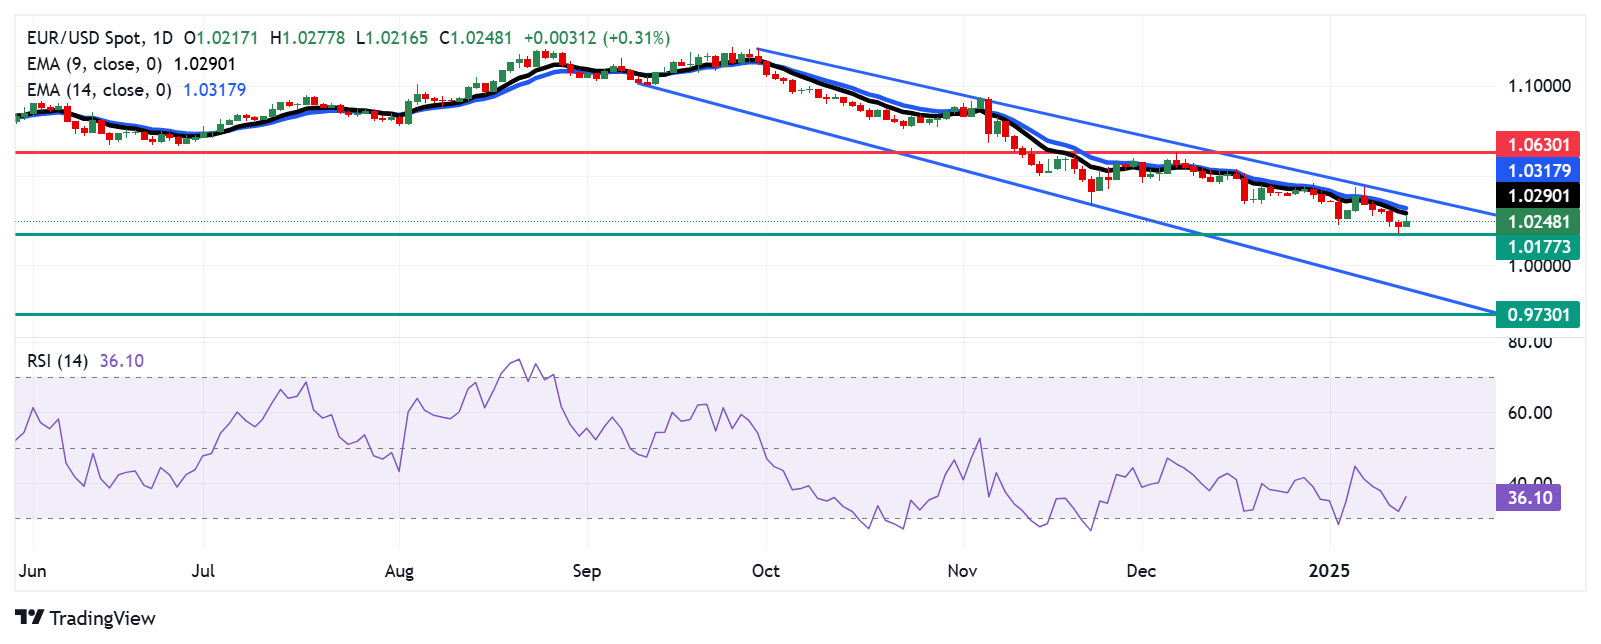
- EUR/USD may struggle as it is confined within a descending channel pattern.
- The 14-day RSI is moving above the 30 level, suggesting a recovery from oversold territory.
- Immediate resistance appears at the nine-day EMA at the 1.0290 level.
The EUR/USD pair halts its five-day losing streak, trading around 1.0250 during the Asian session on Tuesday. A closer analysis of the daily chart suggests a continued bearish trend, with the pair moving lower within a descending channel pattern.
The 14-day Relative Strength Index (RSI), a key momentum indicator, has risen above the 30 level, suggesting a recovery from oversold conditions. However, the EUR/USD pair remains below the nine- and 14-day EMAs, pointing to weak near-term momentum and reinforcing the overall bearish outlook.
On the downside, EUR/USD could revisit its 26-month low of 1.0177, recorded on January 14. A break below this level would lead the pair to test the psychological support level at 1.0000, followed by the lower boundary of the descending channel at 0.9890. A decisive break below this level could strengthen the bearish bias, potentially pushing the pair lower to 0.9730, the lowest point since November 2022.
The EUR/USD pair could find primary resistance near the nine-day EMA at 1.0290, followed by the 14-day EMA at 1.0318. A break above these levels could target the upper boundary of the descending channel at 1.0400, with further gains possible reaching the two-month high of 1.0630, seen on December 6.
EUR/USD: Daily Chart
Euro PRICE Today
The table below shows the percentage change of the Euro (EUR) against the main currencies today. Euro was the strongest currency against the US Dollar.
| USD | EUR | GBP | JPY | CAD | AUD | NZD | CHF | |
|---|---|---|---|---|---|---|---|---|
| USD | -0.30% | -0.24% | -0.02% | -0.13% | -0.39% | -0.71% | -0.24% | |
| EUR | 0.30% | 0.06% | 0.26% | 0.18% | -0.09% | -0.40% | 0.07% | |
| GBP | 0.24% | -0.06% | 0.21% | 0.12% | -0.15% | -0.46% | 0.01% | |
| JPY | 0.02% | -0.26% | -0.21% | -0.10% | -0.37% | -0.70% | -0.22% | |
| CAD | 0.13% | -0.18% | -0.12% | 0.10% | -0.27% | -0.58% | -0.11% | |
| AUD | 0.39% | 0.09% | 0.15% | 0.37% | 0.27% | -0.31% | 0.13% | |
| NZD | 0.71% | 0.40% | 0.46% | 0.70% | 0.58% | 0.31% | 0.48% | |
| CHF | 0.24% | -0.07% | -0.01% | 0.22% | 0.11% | -0.13% | -0.48% |
The heat map shows percentage changes for major currencies. The base currency is selected from the left column, while the quote currency is selected from the top row. For example, if you choose the Euro from the left column and move along the horizontal line to the US Dollar, the percentage change shown in the box will represent EUR (base)/USD (quote).
Source: Fx Street
I am Joshua Winder, a senior-level journalist and editor at World Stock Market. I specialize in covering news related to the stock market and economic trends. With more than 8 years of experience in this field, I have become an expert in financial reporting.


