
- EUR/USD fades initial up move to 0.9985/90.
- Resumption of selling pressure could lead to a test of the year’s low.
EUR/USD rallied to the vicinity of 0.9990 earlier in the session, only to later deflate and return to the 0.9930 area.
In this regard, the pair’s inability to regain upward traction should keep the door open for a further short-term pullback. More dips are immediately targeted at 2022 low at 0.9877 (Sep 5), followed by 0.9859 (Dec 2002 low) and then 0.9685 (Oct 2002 low).
The downtrend continuation is still underway as the daily RSI around 36 is still showing some weakness before reaching oversold territory.
In the long term, the bearish view of the pair is expected to prevail as long as it trades below the 200 SMA at 1.0780.
EUR/USD day chart
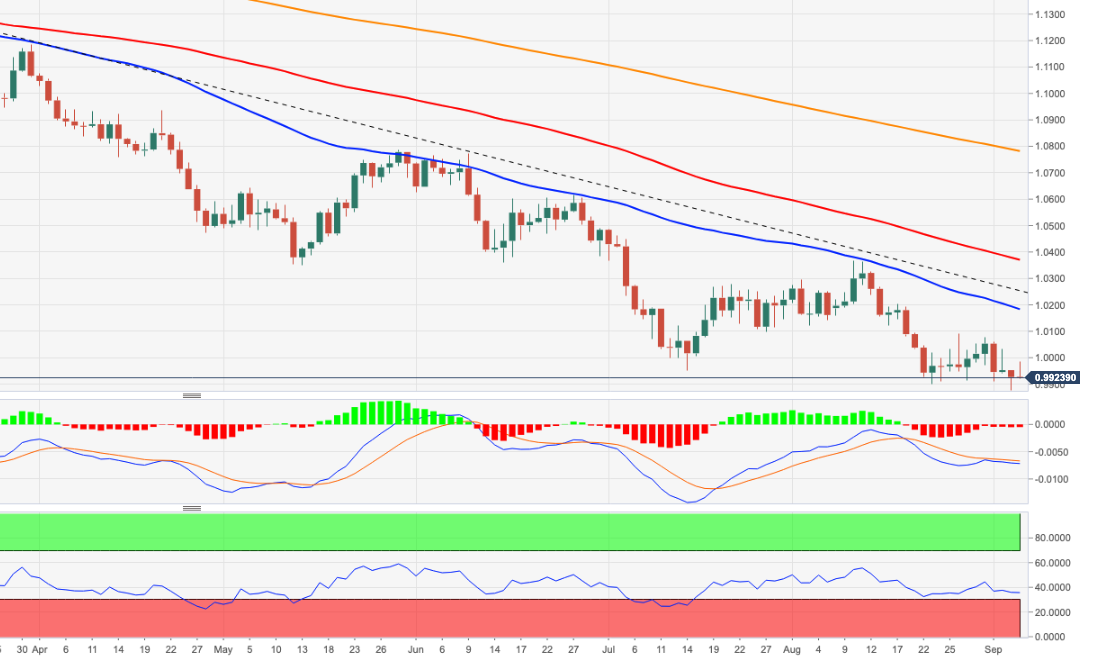
Source: Fx Street
With 6 years of experience, I bring to the table captivating and informative writing in the world news category. My expertise covers a range of industries, including tourism, technology, forex and stocks. From brief social media posts to in-depth articles, I am dedicated to creating compelling content for various platforms.


