
- EUR/USD bounces away from lows near 1.0800.
- Bets for another test of the 2023 high appear to be losing ground.
The EUR/USD managed to reverse the initial pullback to 2-week lows near the 1.0800 zone on Tuesday.
If the dips pick up, the next support to watch would be the weekly low of 1.0766 (Jan 18) before the 3-month support line just above 1.0700.
The continuation of the uptrend now needs to clear the 2023 high at 1.0929 (Jan 26) to allow for a test of the weekly high at 1.0936 (21 Apr 2022). A sustainable break above this level could pave the way for a challenge of the key barrier at 1.1000.
Longer-term, the constructive view remains as long as it holds above the 200-day SMA, today at 1.0311.
EUR/USD daily chart
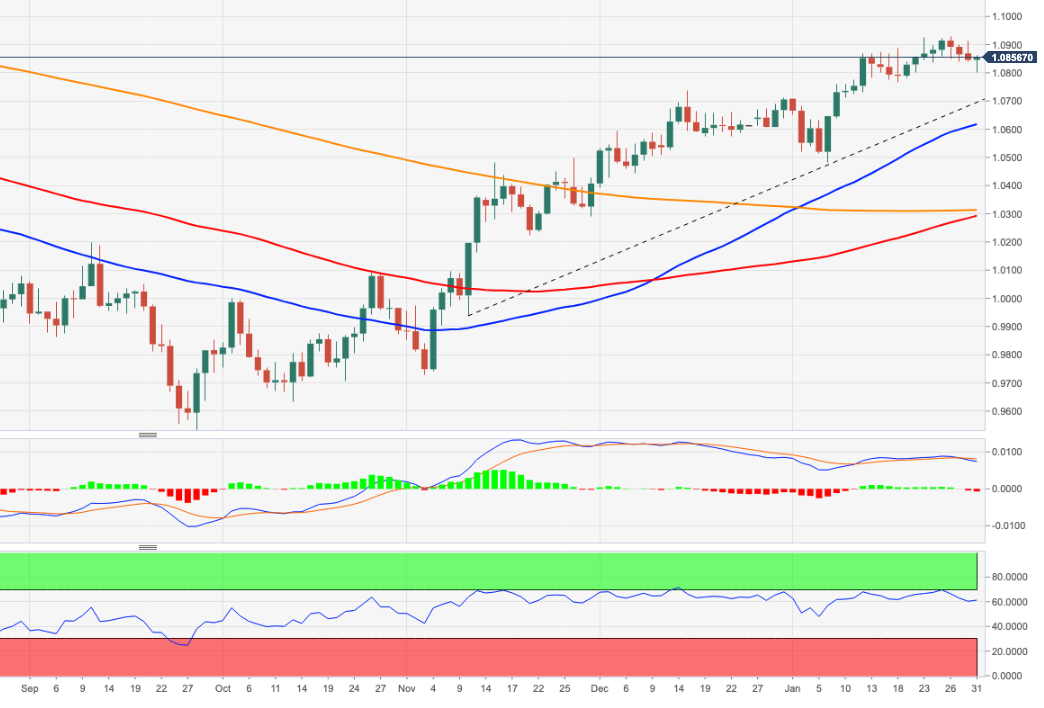
Source: Fx Street
I am Joshua Winder, a senior-level journalist and editor at World Stock Market. I specialize in covering news related to the stock market and economic trends. With more than 8 years of experience in this field, I have become an expert in financial reporting.


