
- EUR/USD consolidates its recovery gains from the more than two-week low hit on Tuesday.
- Investors are eagerly awaiting US employment details before opening fresh directional positions.
- The setup favors bullish traders and supports the prospects for a further appreciating move.
The EUR/USD pair is struggling to capitalize on its gains recorded over the past two days and is hovering in a tight trading range during the Asian session on Friday. Meanwhile, spot prices manage to hold above the 1.1100 round figure, almost unchanged on the day, as traders choose to wait for the release of the US Non-Farm Payrolls (NFP) report before opening fresh directional positions.
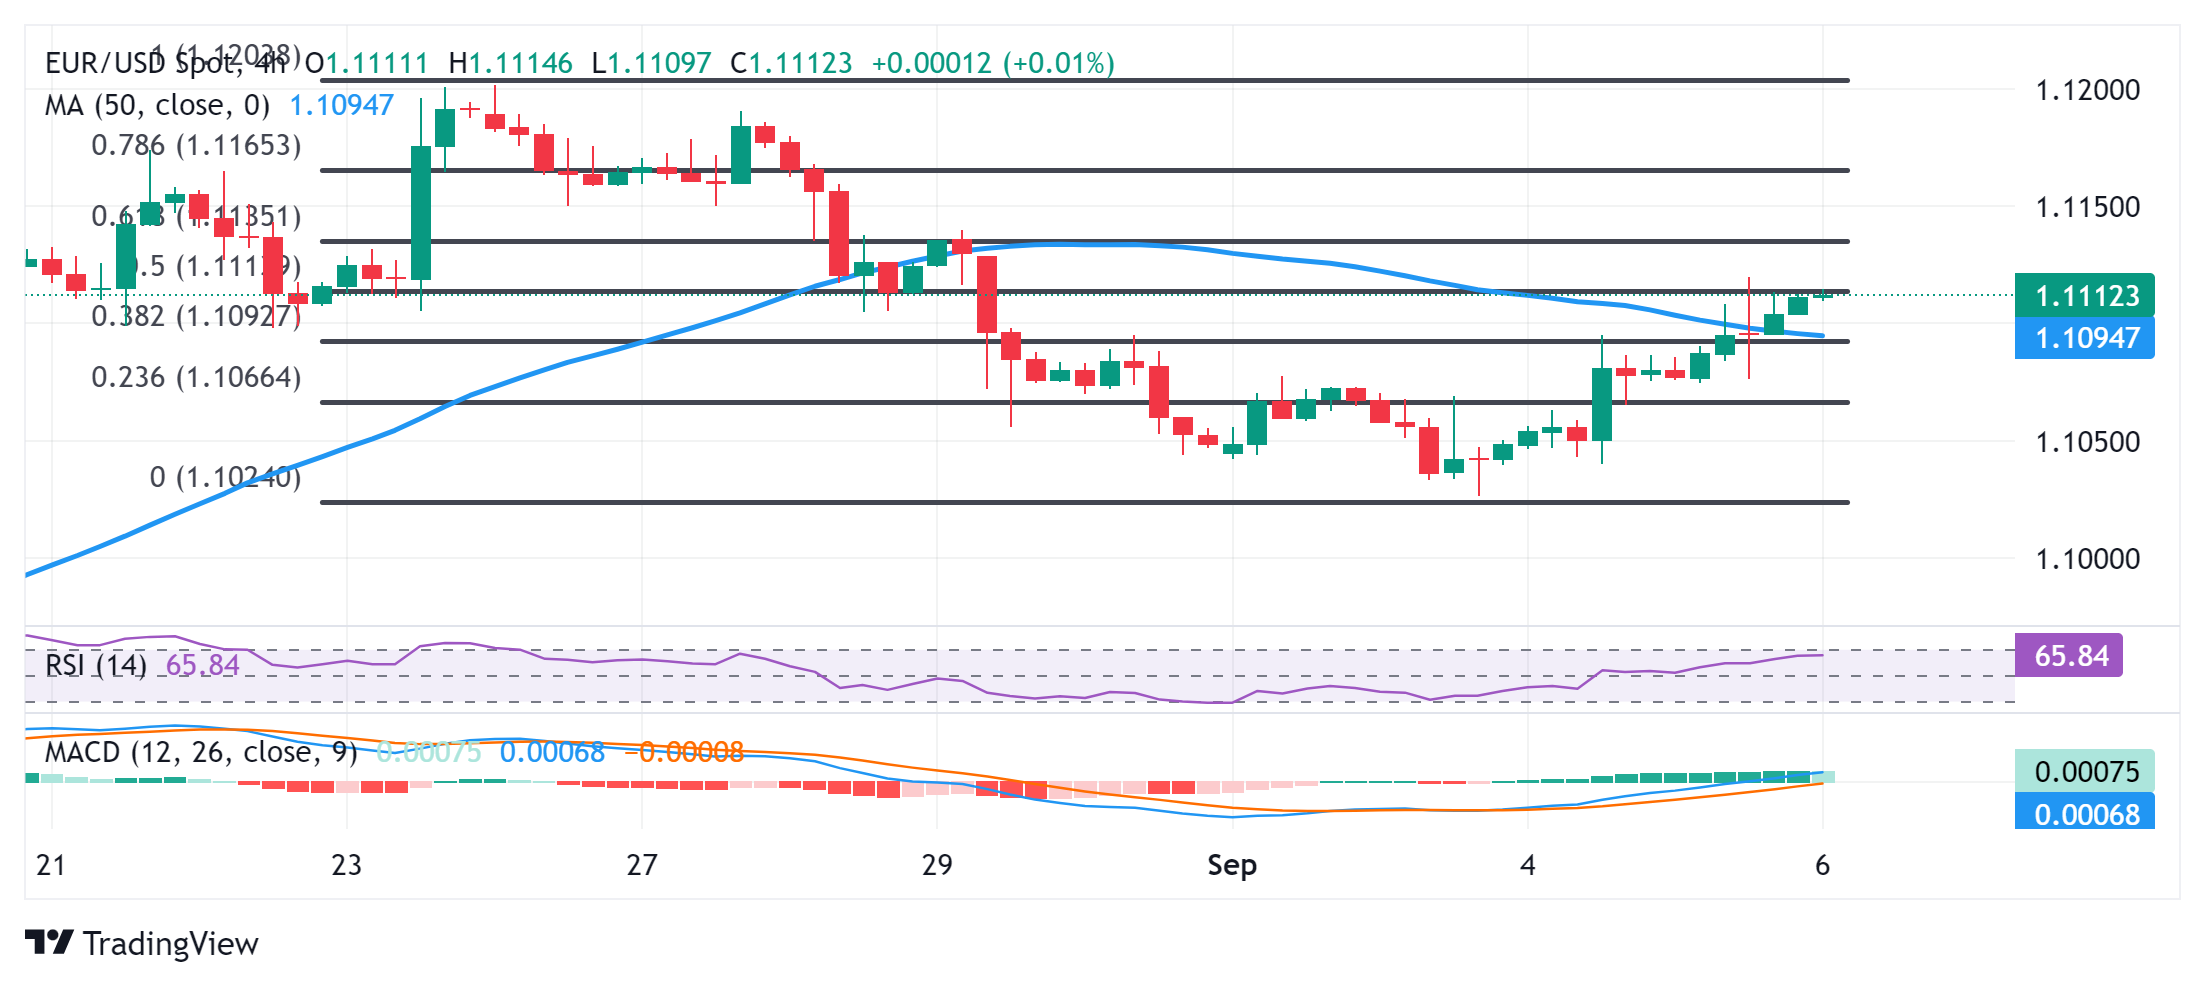
From a technical perspective, the recent recovery from the 1.1075-1.1070 zone, or the more than two-week low touched on Tuesday, stops short of the 50% Fibonacci retracement level of the latest correction from the yearly high touched in August. That said, the overnight break through the 1.1090-1.1095 confluence resistance – which comprises the 38.2% Fibonacci level and the 50-period simple moving average (SMA) on the 4-hour chart – favors bullish traders.
Moreover, oscillators on the daily chart are holding in the positive territory and are still far from being in the overbought zone. This, in turn, validates the positive outlook and suggests that the path of least resistance for the EUR/USD pair is to the upside. The bulls, however, need to wait for a sustained move beyond the 50% Fibonacci resistance level before opening fresh positions and positioning for further strength towards the 61.8% Fibonacci level, around the 1.1135 region.
The subsequent move higher should allow the EUR/USD pair to aim again to test the yearly high, around the 1.1200 level reached in August. Some follow-up buying will confirm a fresh breakout and lift the EUR/USD pair further towards the intermediate barrier of 1.1240-1.1245 en route to the July 2023 high, around the 1.1275 region.
On the other hand, the breakout point of the 1.1095-1.1090 confluence resistance now seems to act as immediate support before the 23.6% Fibonacci level, around the 1.1070-1.1065 region. A convincing break below the latter will expose the weekly low, around the 1.1025 zone hit on Tuesday, before the EUR/USD pair drops to the psychological 1.1000 mark. The latter should act as a crucial point, which if broken could shift the short-term bias in favour of bearish traders.
EUR/USD 4-hour chart
Economic indicator
Nonfarm payrolls
The most important result contained in the employment situation report is the monthly change in non-farm payrolls published by the US Department of LaborThe report publishes estimates of job creation for the previous month and revisions to the data for the previous two months. Monthly changes in payrolls can be very volatile and the release of this report generates high volatility in the dollar. A result above the market consensus is bullish for the dollar, while a result below expectations is bearish.
Next post:
Fri Sep 06, 2024 12:30 PM
Frequency:
Monthly
Dear:
160K
Previous:
114K
Fountain:
US Bureau of Labor Statistics
The US monthly employment report is considered the most important economic indicator for currency traders. Released on the first Friday following the reported month, the change in the number of employees is closely linked to the overall performance of the economy and is monitored by policymakers. Full employment is one of the Federal Reserve’s mandates and it considers developments in the labor market when setting its policies, which affects currencies. Despite several leading indicators shaping estimates, Nonfarm Payrolls tends to surprise markets and trigger substantial volatility. Actual figures that beat consensus tend to be bullish for the USD.
Source: Fx Street
I am Joshua Winder, a senior-level journalist and editor at World Stock Market. I specialize in covering news related to the stock market and economic trends. With more than 8 years of experience in this field, I have become an expert in financial reporting.


