
- The EUR/USD pair set a new 15-week high after breaking above the 1.1000 zone.
- The pair is pulling back as Tuesday’s trading session ends and heads into the close.
- Consumer Confidence in the Eurozone and GDP Growth in the United States will be published on Wednesday.
The EUR/USD pair is retreating to the 1.0980 area after hitting a 15-week high just above 1.1000, driven by increased risk appetite in the broader market, pushing the US Dollar (USD) lower. down across the board and in the red against all other major currencies on Tuesday.
Mixed markets in the first half of trading on Tuesday, before markets rebounded in the US session, with risk bids rising and the dollar facing a sell-off after Federal Reserve (Fed) Governor Christopher Waller will point out that he is confident that monetary policy is strict enough to return inflation to 2%.
Waller added that he sees no reason to keep interest rates high as long as inflation continues to decline, which sparked a risk appetite that sent the broader market higher, dragging down the U.S. dollar.
Eurozone Consumer Confidence and the Economic Sentiment Indicator for November will be released on Wednesday, as well as another edition of quarterly US Gross Domestic Product (GDP) growth.
Eurozone consumer confidence is expected to remain stable at -16.9 for November, while the Economic Sentiment Indicator, a measure of European consumers’ confidence in the European economy, is forecast to see a slight rebound from 93.3. October up to 93.7.
US GDP for the third quarter will be released on Wednesday, with quarter-on-quarter growth of 4.9% to 5.0%.
Quote of the Japanese Yen today
Below is the evolution of the Japanese Yen (JPY) against the major currencies. The Japanese Yen was the strongest currency against the US Dollar.
| USD | EUR | GBP | CAD | AUD | JPY | NZD | CHF | |
| USD | -0.28% | -0.47% | -0.25% | -0.49% | -0.68% | -0.50% | -0.25% | |
| EUR | 0.28% | -0.19% | 0.03% | -0.21% | -0.38% | -0.22% | 0.04% | |
| GBP | 0.46% | 0.19% | 0.23% | -0.02% | -0.20% | -0.03% | 0.23% | |
| CAD | 0.23% | -0.06% | -0.25% | -0.27% | -0.43% | -0.27% | -0.02% | |
| AUD | 0.51% | 0.21% | 0.04% | 0.26% | -0.17% | 0.01% | 0.28% | |
| JPY | 0.66% | 0.38% | 0.20% | 0.42% | 0.17% | 0.16% | 0.43% | |
| NZD | 0.50% | 0.20% | 0.03% | 0.26% | -0.01% | -0.17% | 0.26% | |
| CHF | 0.23% | -0.06% | -0.24% | -0.01% | -0.26% | -0.45% | -0.27% |
The map shows the percentage changes of the major currencies against each other. The base currency is chosen in the left column, while the quote currency is chosen in the top row. For example, if you choose the euro in the left column and scroll down the horizontal line to the Japanese yen, the percentage change in the box will represent EUR (base)/JPY (quote).
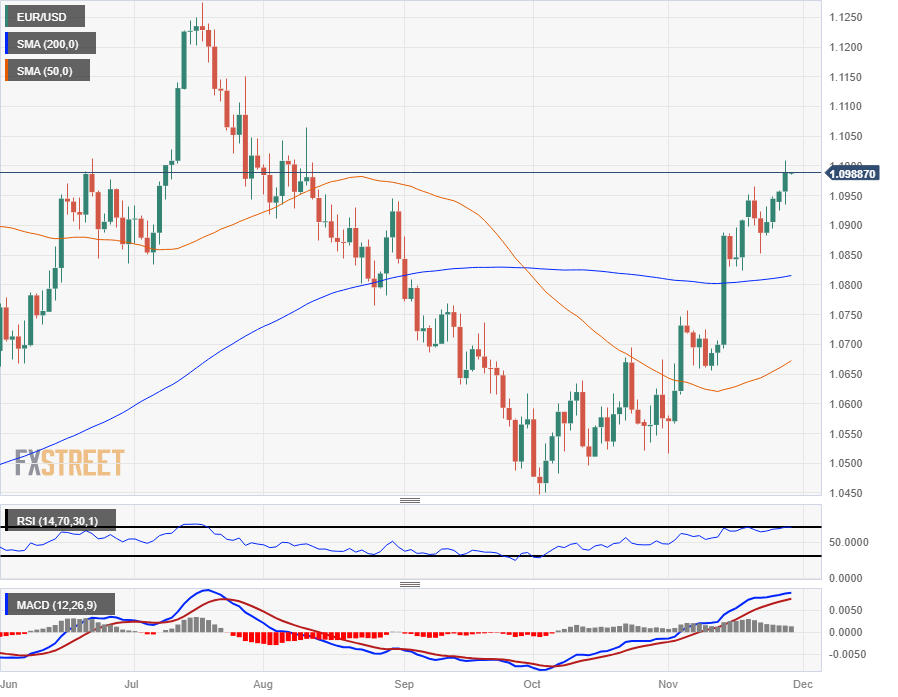
EUR/USD Technical Outlook
The Euro’s rally fueled by dollar selling in the broader forex market saw EUR/USD trim back into the 1.1000 zone before settling back into Tuesday’s close, but still up three tenths of a percent on the day .
The EUR/USD pair easily surpassed the 200-day SMA in mid-November, near the 1.0800 area, and the Euro’s continued bullish trend is driving the pair higher while the dollar falters.
The pair might have risen too much, too fast, with the 50-day SMA still trading well below prices and in bearish territory, and the moving average turning higher from north of 1.0650.
The Relative Strength Index (RSI) is showing warning signs that EUR/USD may have gone too far, almost testing the overbought limit line, and could see a prolonged pullback if the bears are able to capitalize on any taking profits.
EUR/USD Daily Chart
EUR/USD technical levels
Source: Fx Street
I am Joshua Winder, a senior-level journalist and editor at World Stock Market. I specialize in covering news related to the stock market and economic trends. With more than 8 years of experience in this field, I have become an expert in financial reporting.


