
- The EUR/USD pair returns to the day’s highs after the Fed left policy rates unchanged.
- The Euro experiences a rebound, while the Dollar falls after the firmness of the Fed.
- Markets’ risk appetite is rising again after the Fed’s Powell held firm for the second month in a row.
The pair EUR/USD recovers towards Wednesday’s highs, after the Federal Reserve’s (Fed) firmness on interest rates pushed the US Dollar (USD) back towards the day’s low bids.
The Fed kept rates steady at 5.25-5.5%, as markets expected, and there were few changes to the Fed’s rate statement compared to the previous month.
Markets blinked after investors expected a much tougher statement from Fed Chair Jerome Powell, who noted that high rates and corresponding rises in yields are weighing on economic growth and inflation, although the Fed did not completely close the door on future rate hikes if price growth threatens to get out of control.
With the Fed presentation out of the way, markets are free to focus on Friday’s upcoming US Nonfarm Payrolls (NFP) for October.
Markets expect NFP employment gains to cool slightly, with the October NFP forecast at 180,000 compared to the September sample of 336,000.
EUR/USD Technical Outlook
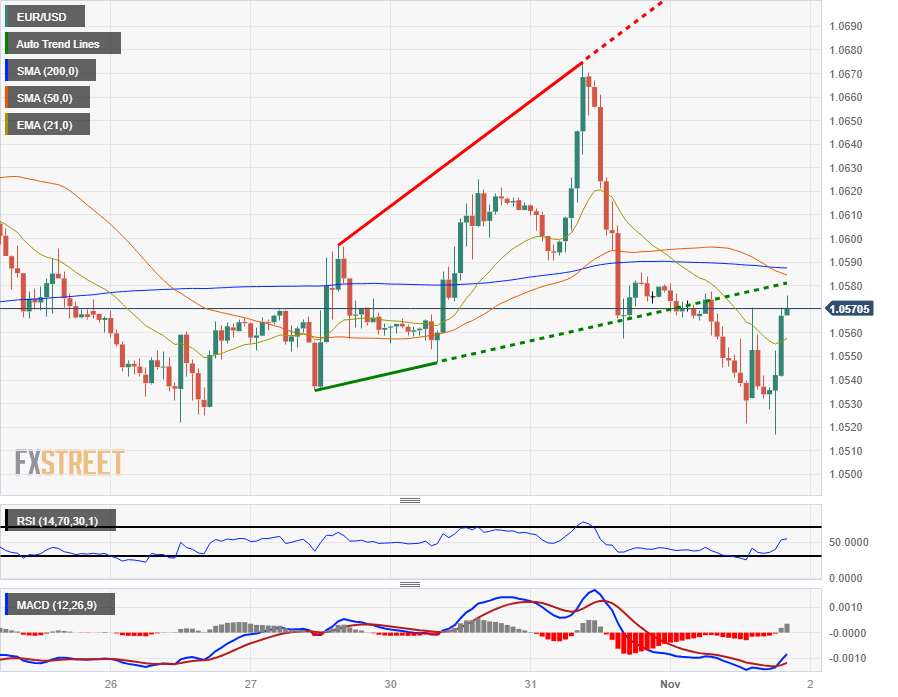
The Euro opened on Wednesday near 1.0580, falling to a low of 1.0517 against the US Dollar ahead of the Fed’s rate call.
Markets have reacted to risk appetite after the Fed, and EUR/USD is trading back into the day’s opening bids.
On the intraday chart, the 50 and 200 hourly simple moving averages (SMA) are moving in the mid-range, as the pair loses momentum in the medium term.
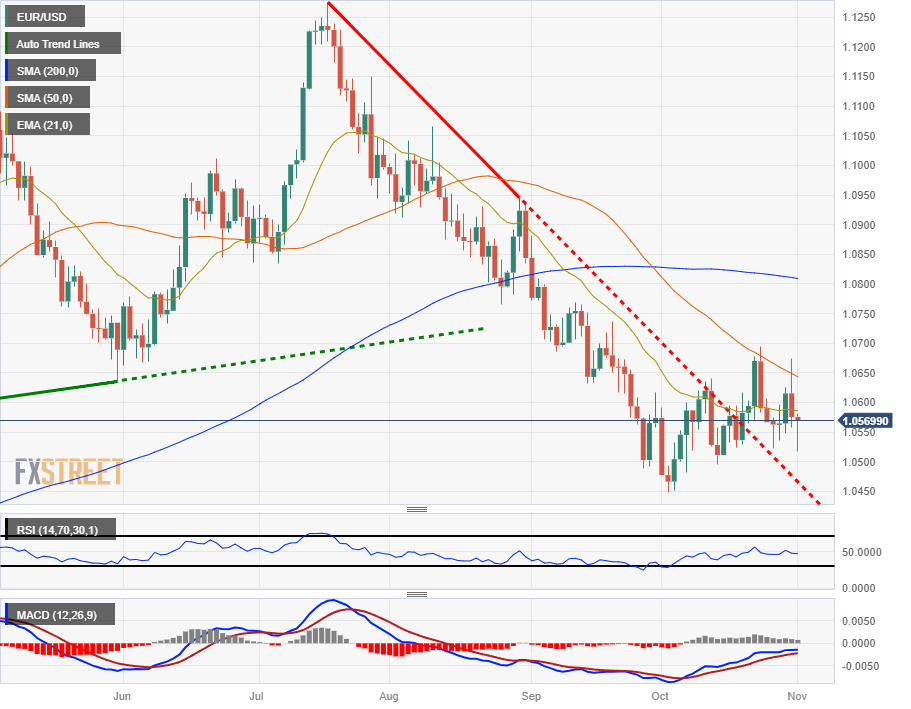
On the daily candlesticks, bullish momentum continues to be hampered by the 50-day SMA, with bids continuing in a tight cycle with the 21-day EMA.
EUR/USD Hourly Chart
EUR/USD Daily Chart
EUR/USD technical levels
Source: Fx Street
I am Joshua Winder, a senior-level journalist and editor at World Stock Market. I specialize in covering news related to the stock market and economic trends. With more than 8 years of experience in this field, I have become an expert in financial reporting.


