
- Quiet day in the financial markets, awaiting key inflation data from the US.
- The dollar without a clear direction, confirming recent falls.
- EUR/USD remains sideways, above 1.0700 and limited by 1.0760.
The EUR/USD is trading in the 1.0750 zone, at the highest levels since June 2022. For several sessions, the pair has been moving between 1.0710 and 1.0762, confirming the strong rises of last Friday and Monday.
The key factor behind the advance has been the weakness of the dollar. The greenback is under pressure from lower Treasury yields on expectations that the Federal Reserve will ease its tough policy. In this regard, what the US inflation data says on Thursday will be important. That is where all eyes are directed.
The euro for its part continues to be one of the strongest currencies in Europe and shows gains against the Swiss franc and the pound. The common currency is supported by comments from European Central Bank (ECB) officials that interest rates will continue to rise for several meetings.
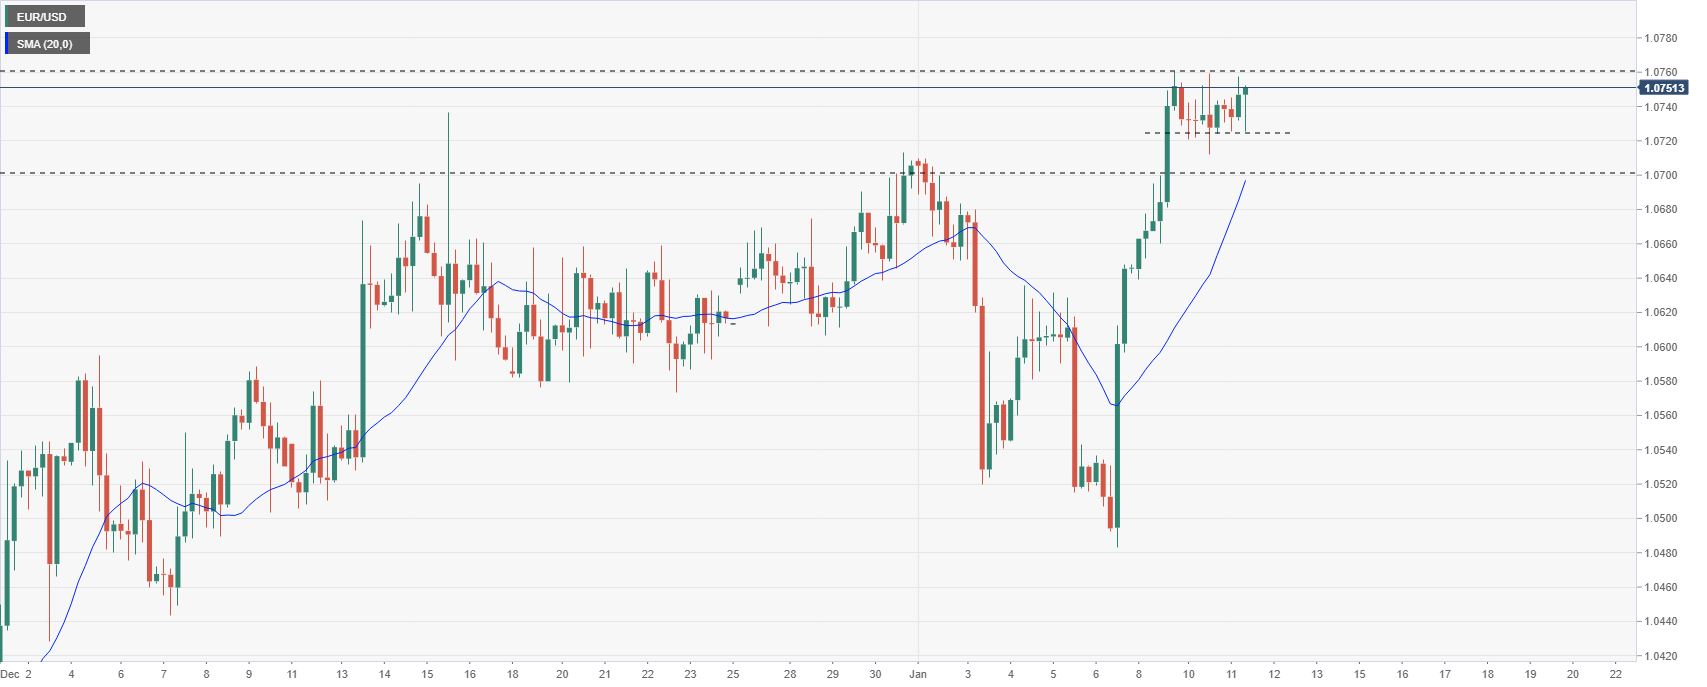
The EUR/USD trend remains bullish, with various technical indicators near overbought levels. The advance from levels below 1.0500 has slowed for now, at the 1.0760 area, which is resistance to break. If it does, the next target is 1.0790, the May 2022 high.
Going the other way, the Euro would lose momentum to fall below 1.0700/1.0695, confluence of a flat level and the 20 four-hour moving average. The next support is at 1.0660.
EUR/USD four-hour chart
technical levels
Source: Fx Street
I am Joshua Winder, a senior-level journalist and editor at World Stock Market. I specialize in covering news related to the stock market and economic trends. With more than 8 years of experience in this field, I have become an expert in financial reporting.


