
- The EUR/USD tested the 1.0900 level following the release of the latest Fed meeting minutes.
- On Tuesday, the Euro fell sharply against the US Dollar.
- Coming soon: U.S. jobless claims and EU consumer confidence will be released on Wednesday.
The pair EUR/USD fell to the 1.0900 area at the end of the session on Tuesday, after the latest Federal Reserve (Fed) minutes from the US central bank meeting from October 31 to November 1 revealed that The Federal Open Market Committee (FOMC) remains firmly committed to raising rates to combat future inflation expectations.
Markets initially turned upside down following the release but remain steady heading into Wednesday trading despite the notable tonal disconnect between a hawkish Fed and broader markets’ desire for a rate cut cycle to begin. .
FOMC Minutes: Further tightening would be appropriate if progress toward inflation target was insufficient
With the Fed meeting minutes released, markets will now focus on Wednesday’s US jobless claims and November’s EU consumer confidence survey.
US Initial Jobless Claims for the week ending November 17 are expected to decline slightly to 225,000, from the previous week’s multi-year high of 231,000; The 4-week average for initial jobless claims is currently 220,250.
The Michigan Consumer Sentiment Index is expected to improve slightly in November, from 60.4 to 60.5, and US Durable Goods Orders in October are expected to decline from 4.6% to -3.1%. US inflation expectations are also expected to remain stable at 3.2% in November.
As for the EU, consumer confidence is expected to improve, although only slightly: analysts predict a slight rebound, from -17.9 to -17.6 points.
Euro prices today
The following table shows the percentage variation of the Euro (EUR) against the main currencies quoted today. The Euro was the weakest currency against the British Pound.
| USD | EUR | GBP | CAD | AUD | JPY | NZD | CHF | |
| USD | 0.28% | -0.23% | -0.18% | 0.10% | 0.00% | -0.13% | -0.09% | |
| EUR | -0.29% | -0.50% | -0.46% | -0.21% | -0.30% | -0.42% | -0.38% | |
| GBP | 0.23% | 0.52% | 0.05% | 0.31% | 0.23% | 0.10% | 0.14% | |
| CAD | 0.19% | 0.47% | -0.04% | 0.26% | 0.17% | 0.05% | 0.09% | |
| AUD | -0.10% | 0.21% | -0.30% | -0.26% | -0.09% | -0.21% | -0.15% | |
| JPY | 0.00% | 0.28% | -0.22% | -0.19% | 0.07% | -0.15% | -0.08% | |
| NZD | 0.13% | 0.42% | -0.09% | -0.05% | 0.21% | 0.08% | 0.04% | |
| CHF | 0.09% | 0.38% | -0.14% | -0.10% | 0.17% | 0.08% | -0.04% |
The map shows the percentage changes of the major currencies against each other. The base currency is chosen in the left column, while the quote currency is chosen in the top row. For example, if you choose the euro in the left column and scroll down the horizontal line to the Japanese yen, the percentage change in the box will represent EUR (base)/JPY (quote).
EUR/USD Technical Outlook
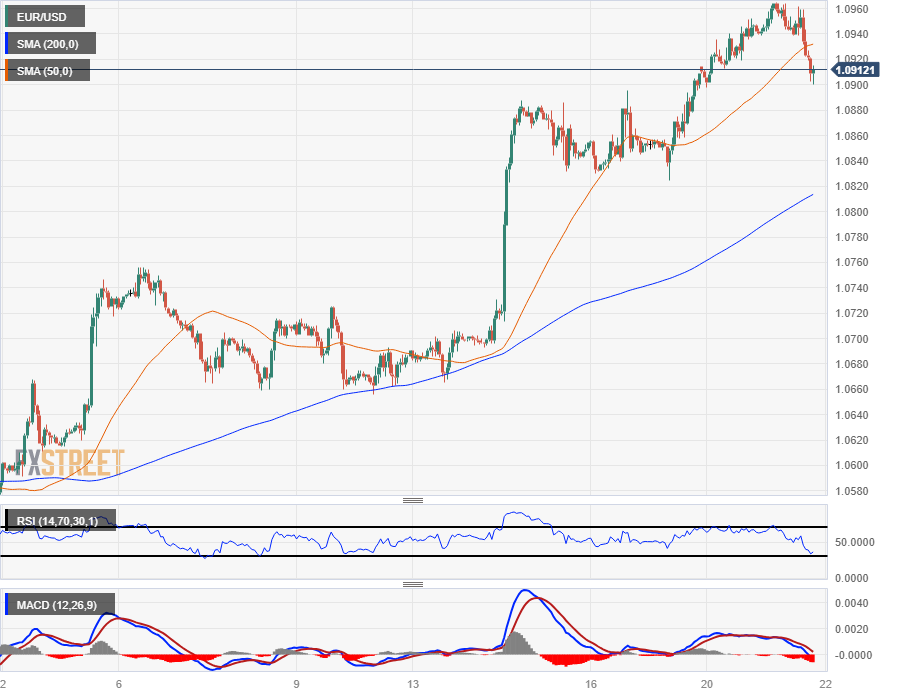
The Euro (USD) is experiencing an intraday pullback against the US Dollar (USD), moving away from the week’s high of 1.0965 and trading in the 1.0900 area. Short-term momentum in EUR/USD has the pair trading higher, with bids well above the 200 hourly moving average (SMA) and reaching 1.0820.
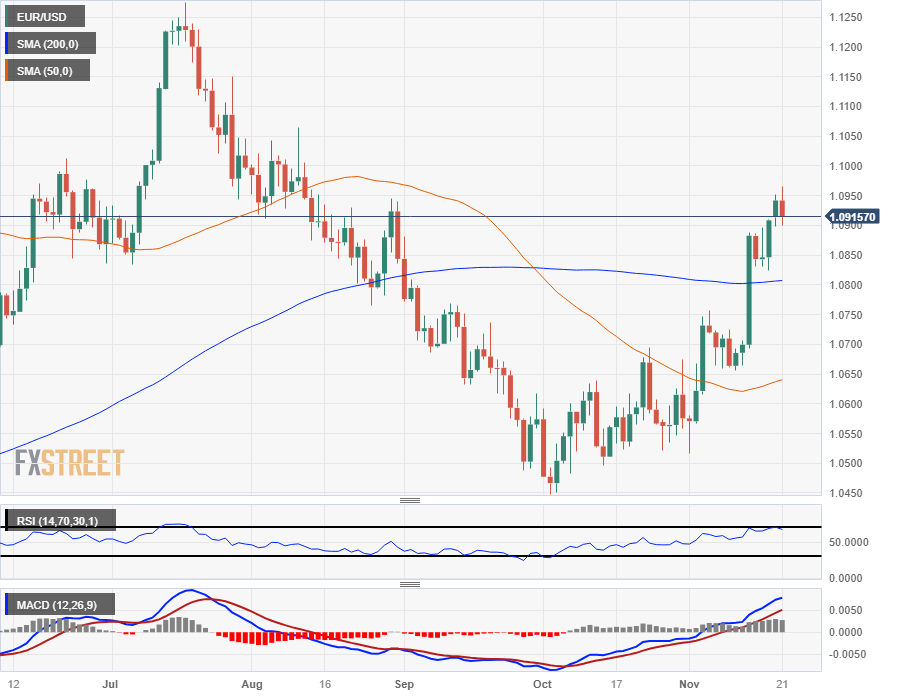
Following Tuesday’s rally, EUR/USD hit its highest bids since early August, but the pair was unable to hold on to the 1.0950 level and has retreated, although it remains firmly bullish. The pair is trading north of the 200-day SMA near 1.0800 and has plenty of room to run as long as the bears do not pull the pair down.
On the bearish side, the Relative Strength Index (RSI) is in overbought territory on daily candlestick charts, implying that a pullback could find additional strength.
EUR/USD Hourly Chart
EUR/USD Daily Chart
Source: Fx Street
I am Joshua Winder, a senior-level journalist and editor at World Stock Market. I specialize in covering news related to the stock market and economic trends. With more than 8 years of experience in this field, I have become an expert in financial reporting.


 on the water: her floating festival in Trieste is pure magic")


