
- EUR/USD is trading at 1.0677, extending losses by 0.01%, while the 10-year US Treasury yield hits 16-year highs.
- Divergent rate hike expectations between the Fed and ECB could weigh on EUR/USD.
- Market participants await the Federal Reserve’s decision and updated economic projections for directional signals.
At the beginning of the Asian session, the Euro (EUR) extends its losses by 0.01% against the US Dollar (USD), as market participants prepare for the decision of the United States Federal Reserve. The dollar is rising, driven by the rise in US Treasury bond yields. The pair EUR/USD is trading at 1.0677, following losses of 0.12% on Tuesday.
Euro faces headwinds while Dollar strengthens on rising Treasury yields, with all eyes on next Fed decision
US stocks ended the day with losses. US 10-year Treasury yields soared to 16-year highs of 4.367%, providing a headwind for EUR/USD, which remains near the 1.0700 area but will continue to print losses amid speculation that the Fed will be very aggressive.
As the latest data from the United States (US) shows the strength of the economy, with a hot labor market, improving business activity and expanding consumer spending – albeit at a slower pace – are reasons for Fed Chairman Powell and company to stay “at it” and keep rates higher for longer. Additionally, last week’s Consumer and Producer Price Index (CPI and PPI) showed higher readings, justifying the need to raise rates.
In addition to making their monetary policy decision, monetary policymakers would update their economic forecasts for growth, unemployment rate, inflation, and federal funds rate (FFR). In June, Fed officials expected the FFR to peak around 5.60%. Despite this, money market futures forecast the FFR to peak around 5.46%.
On the data front, the thin US economic agenda revealed mixed data on housing. US building permits improved from July’s 0.1% expansion and grew 6.9%, while housing starts fell -11.3%, below the estimated -2.5% contraction .
On the other side of the pond, the economic agenda of the Eurozone (EU) published inflation data. The Harmonized Index of Consumer Prices (HICP) for August stood at 5.2% year-on-year, below the 5.3% estimate, while the core HICP stood at 5.3% unchanged, in line with estimates.
Recently, some European Central Bank (ECB) officials signaled that the ECB would not continue to tighten monetary conditions. However, the ongoing economic slowdown in the bloc and a deposit rate at its highest level since the creation of the euro, 4.00%, could bring inflation closer to its target.
According to a Reuters poll, 70 economists believe that the ECB has finished raising rates and that the deposit rate will end the year at its current level of 4.00%. Although ECB President Christine Lagarde stopped short of saying rates have peaked, money market futures see a 25% chance of further hikes by the end of the year.
Given the background, if the Fed maintains a hawkish stance, EUR/USD can be expected to continue declining; Otherwise, the single currency could rally and reclaim the 1.0700 level, with buyers targeting 1.0800.
EUR/USD Price Analysis: Technical Outlook
The daily chart shows an “evening star” in the making, as Tuesday’s candle was an “inverted hammer,” which could pave the way to the downside. However, upside risks remain as the EUR/USD pair approaches the 1.0700 area. If the Fed is hawkish, it could test the September 14 low at 1.0632, followed by 1.0600, before falling towards the March low at 1.0516. On the contrary, if the Fed is dovish, the EUR/USD could recover and surpass the September 19 high at 1.0718 and head towards the 200-day moving average (DMA) at 1.0828.
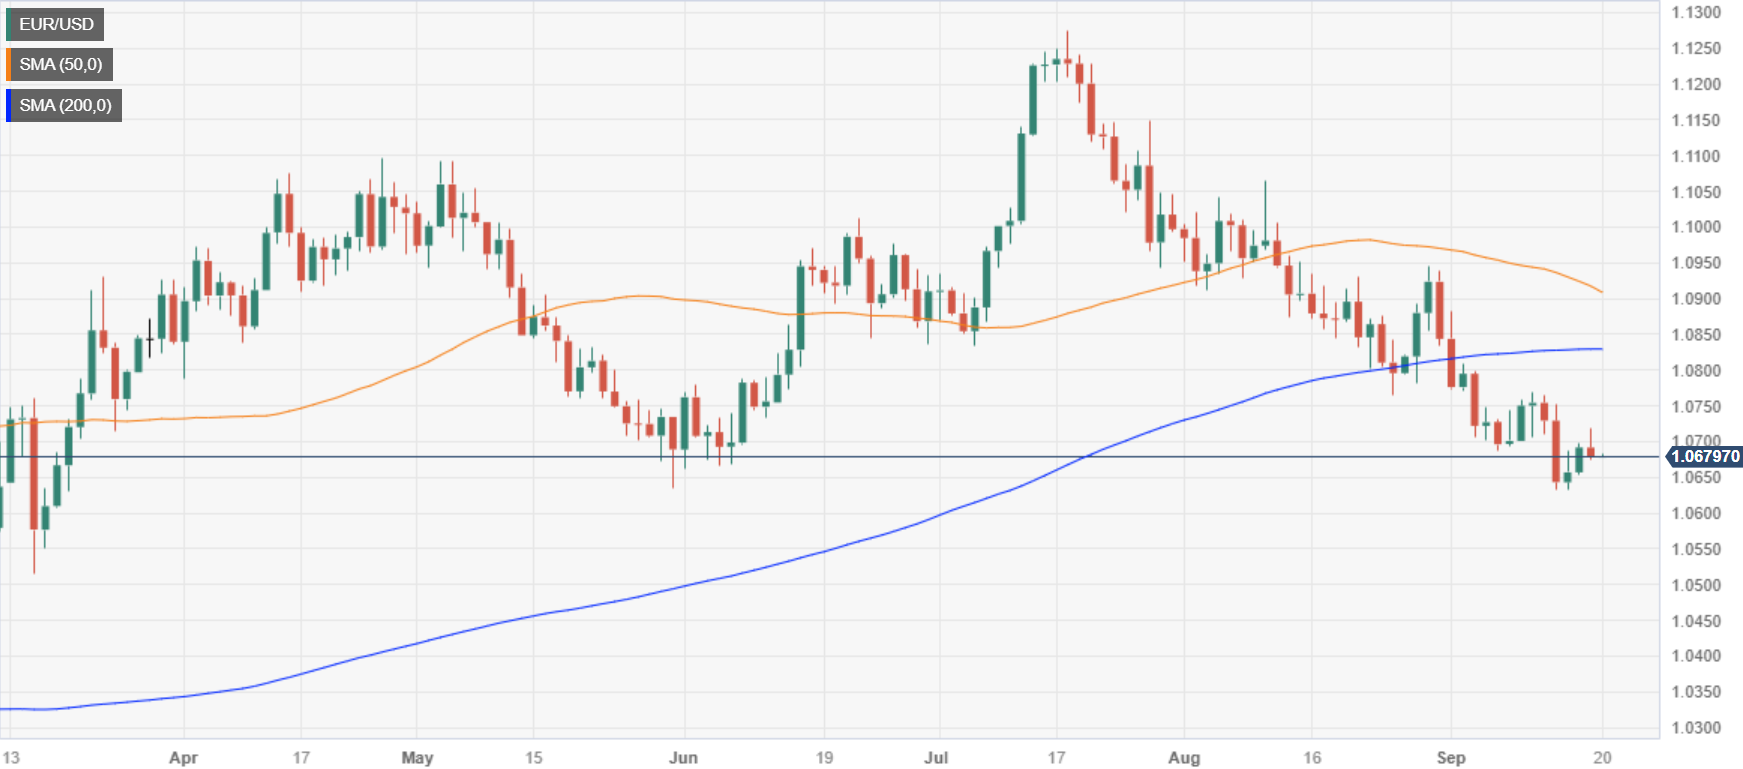
Source: Fx Street
I am Joshua Winder, a senior-level journalist and editor at World Stock Market. I specialize in covering news related to the stock market and economic trends. With more than 8 years of experience in this field, I have become an expert in financial reporting.


