
- EURJPY extends weekly leg lower for third session in a row.
- Immediately to the downside is the 144.00 area.
EURJPY posts third straight day of losses and breaks below key support at 146.00 on Thursday.
The cross appears to have embarked on a corrective phase and a continuation of this stance could challenge the November low at 144.03 (3 Nov) in the short term. Further south awaits the 55-day Simple Moving Average (SMA), today at 143.28.
In the short term, the bullish momentum is expected to persist as long as it is above the October lows near 141.00.
In the longer term, as long as it is above the key 200-day SMA at 138.03, the constructive outlook is expected to hold.
EURJPY day chart
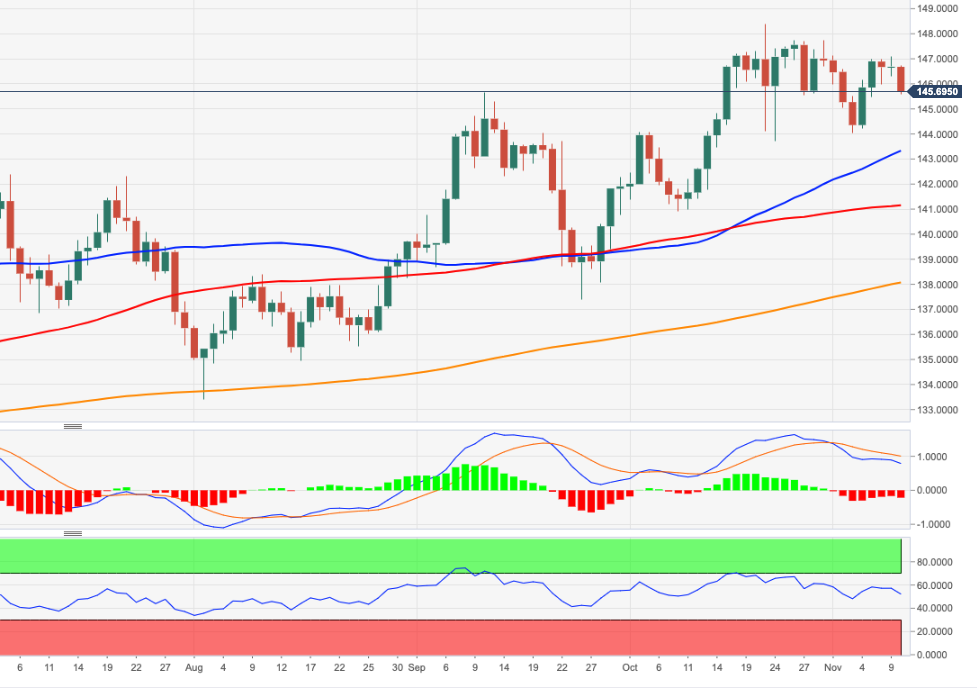
Source: Fx Street
With 6 years of experience, I bring to the table captivating and informative writing in the world news category. My expertise covers a range of industries, including tourism, technology, forex and stocks. From brief social media posts to in-depth articles, I am dedicated to creating compelling content for various platforms.


