
- EURJPY extends weekly decline and breaks below 143.00.
- The next target on the downside is the October lows near 140.90.
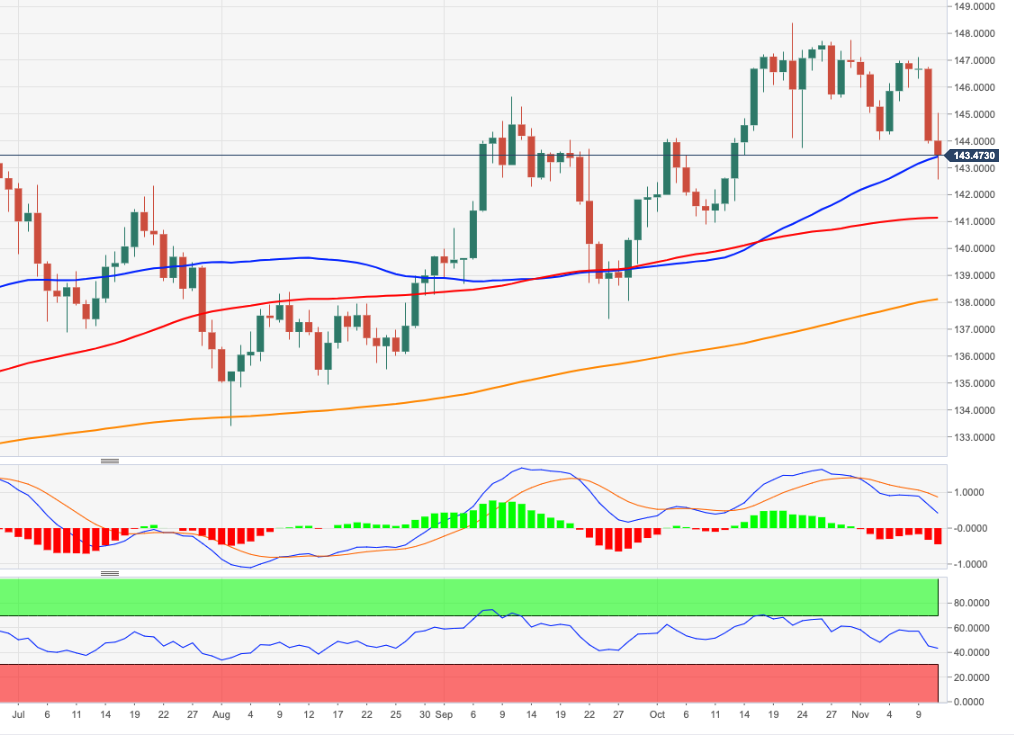
EURJPY accelerates its decline and breaks the key support at 143.00 on Friday.
The cross appears to have entered a corrective phase and a continuation of this stance could now extend to the October low near 140.90, an area that coincides with the 3-month support line (from the August low).
In the longer term, as long as it is above the key 200 SMA at 138.08, the constructive outlook is expected to hold.
EURJPY day chart
Source: Fx Street
With 6 years of experience, I bring to the table captivating and informative writing in the world news category. My expertise covers a range of industries, including tourism, technology, forex and stocks. From brief social media posts to in-depth articles, I am dedicated to creating compelling content for various platforms.


