
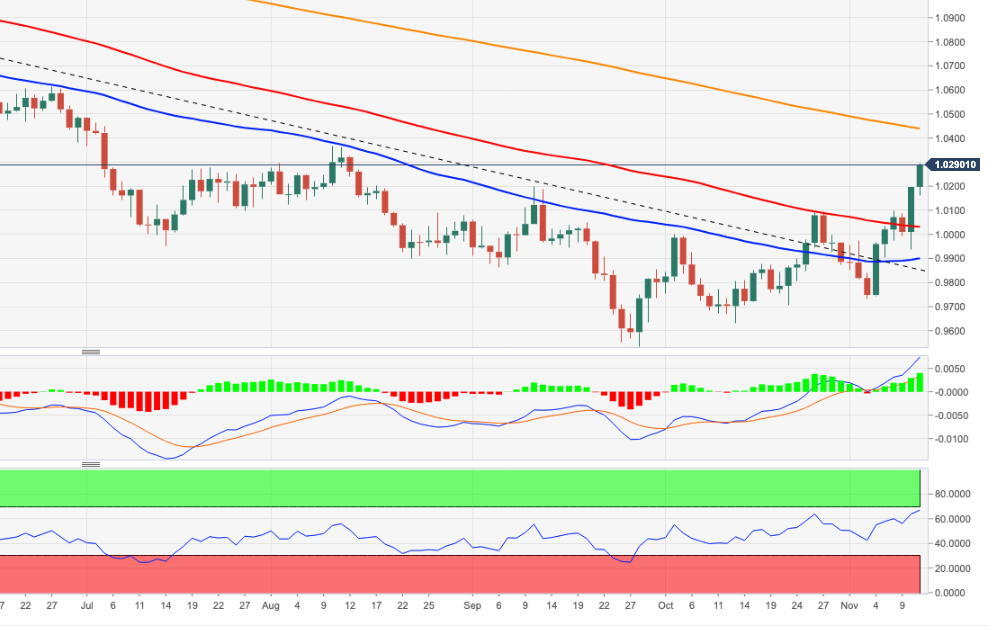
- EURUSD accelerates the advance and reaches the 1.0300 zone.
- The August high at 1.0368 looks like the next target.
EURUSD adds to Thursday’s strong advance and flirts with the key barrier in the 1.0300 area at the end of the week.
The continuation of the recovery seems the most likely scenario in the short term. Conversely, further upside could prompt the pair to challenge the August high at 1.0368 (Aug 10) ahead of the ever-relevant 200 SMA today at 1.0437.
In the longer term, the bearish view of the pair should remain unchanged as long as it is below the latter.
EURUSD day chart
Source: Fx Street
With 6 years of experience, I bring to the table captivating and informative writing in the world news category. My expertise covers a range of industries, including tourism, technology, forex and stocks. From brief social media posts to in-depth articles, I am dedicated to creating compelling content for various platforms.


