
- EURUSD corrects to moderate lower after recent strength.
- Next support lies at the 100-day SMA near 1.0020.
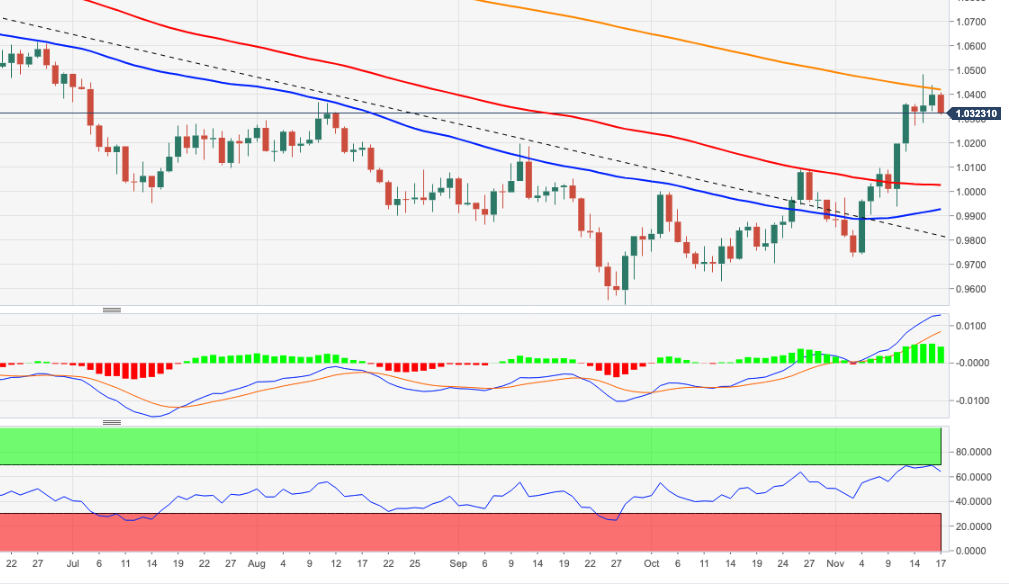
The EURUSD comes under pressure after two consecutive daily rallies and pulls back to the 1.0300 level on Thursday.
The pair’s inability to close above the 1.0400 level coupled with the proximity of overbought territory seems to have triggered some correction in the pair. Against this, further losses have the potential to drag spot down to the 100-day SMA today at 1.0024. The loss of this zone could put a test of the parity zone back on the radar.
For now, as long as it is below the 200-day SMA, the outlook for the pair remains bearish.
EURUSD daily chart
Source: Fx Street
I am Joshua Winder, a senior-level journalist and editor at World Stock Market. I specialize in covering news related to the stock market and economic trends. With more than 8 years of experience in this field, I have become an expert in financial reporting.


