
- The Federal Reserve will not change interest rates, but will signal their next moves via its dot plot.
- The new forecasts for the maximum costs of borrowing in 2023 and 2024 will provoke an immediate reaction.
- Markets tend to reverse some moves after the dot chart release.
Markets always look to the future, and the dot chart of the federal reserve (Fed) is something that investors can hold onto to anticipate its next moves. Furthermore, the Fed figures can be read by algorithms, triggering a fast and furious response. For retail traders who fear missing out, the backlash to this initial response to the dot chart offers a trading opportunity.
Below is a preview of the Fed’s decision and dot chart, to be released on Wednesday at 18:00 GMT.
Federal Reserve Chairman Jerome Powell and his colleagues prefer to pre-announce the rate decision. senior officials signaled an upcoming pause in the interest rate hike cycle, the first breather the Fed has taken in more than a year. However, several members of the Federal Open Market Committee (FOMC) have stressed that it could just be a “jump”: leaving rates unchanged now to resume them in July.
How quickly will the markets assess what lies ahead? This is where the dot plot comes in handy. Every three months, the Fed publishes a Summary of Economic Forecasts. At first, this document consisted solely of a chart with the projections of various Fed members, each represented by a dot, hence the name: dot chart.
What the Federal Reserve Dot Plot looks like:
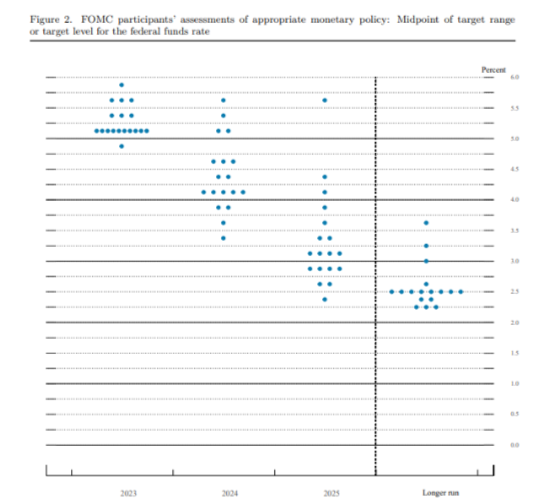
Source: Federal Reserve
Later, the bank added a handy table summarizing the range of forecasts and, more importantly, the median. The Fed publishes the forecasts for economic growth, the unemployment rate and inflation reflected in the Personal Consumption Expenditure (PCE) indicator, as well as the underlying PCE measure, and the icing on the cake: the interest rate.
This dot chart is only published once every two meetings, which gives them more impact. In March, The Fed kept the median interest rate projection for end-2023 at 5.1%, but raised the end-2024 forecast to 4.3% from 4.1%, indicating that policymakers expected rates to remain high for more time.
Aspect of the dot plot in table format. The figures on the bottom left are the most important – the updated interest rate forecast for the end of this year and next:
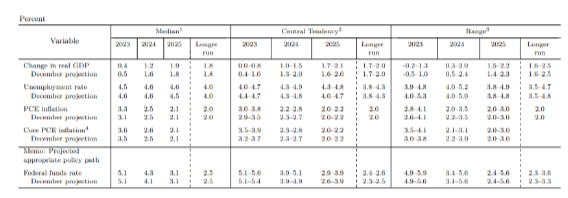
Source: Federal Reserve
The current Federal Funds rate is in a range of 5.00-5.25%, as forecast by the Fed for the end of the year. Officials insisted no rate cuts are foreseen for 2023. Markets initially expected looser monetary policy by the end of the year, but reluctantly sided with the Fed’s view after several hawkish comments from officials.
Bond markets expect rates to end the year at current levels, after a possible hike in July. However, uncertainty is through the roof, which translates into high volatility.
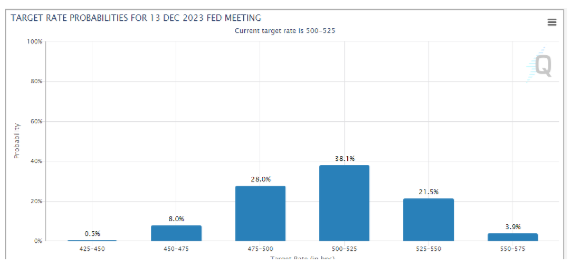
Source: CME Group
How to trade the Fed dot chart – three scenarios
Is Fed likely to want to leave door open for July rate hike while continuing to refrain from rate cuts this year. This view implies a bump in the dot chart, which would lead to a median interest rate forecast of 5.3% or 5.4% at the end of 2023.
I see this scenario as the most likely, which would lead to a knee-jerk reaction to the US dollar and a crash in the stock markets. But, as already mentioned, the moves could quickly reverse pending Fed Chairman Jerome Powell’s press conference 30 minutes after the release.
And for good reason. Powell could soften any hawkish perceptions by reiterating that the Fed is data dependent. Signs of a slowdown in the US economy could continue to accumulate between Fed meetings.
In this dominant scenario, the dot chart would provide an opportunity to go against the US dollar.
He second scenario is a hardline outcome: The dot chart shows that the Fed raises its forecast to 5.5% by the end of 2023. This would spook the markets and send the Dollar higher.
A reversal would only occur if Powell substantially contrasts or softens the subsequent message.. Investors are unlikely to send the dollar lower before hearing from Powell.
He third scenario, a very unlikely moderate outcomeis for the dot plot to remain unchanged by 2023. If the Fed refuses to signal a net increase in borrowing costs by the end of the year, the US dollar will plunge. Much like the expected behavior in response to the hawkish result, there is room for a reversal only when Powell speaks.
You could say that if inflation rises, the Fed could still raise rates. However, I don’t expect an instant correction, but rather markets to move only after confirmation from the Fed Chairman.
Final thoughts
The Federal Reserve’s dot chart is critical for instant market reaction, and for countertrend. I suggest that you trade cautiously, as the markets tend to be choppy around this event.
Fed FAQ
What does the Federal Reserve do and how does it affect the dollar?
Monetary policy in the United States is determined by the Federal Reserve (Fed). The Fed has two mandates: to achieve price stability and to promote full employment. Its main tool to achieve these objectives is to adjust interest rates.
When prices rise too fast and inflation exceeds the 2% target, the Fed raises interest rates, raising borrowing costs across the economy. The result is a stronger dollar, as it makes the United States a more attractive place for international investors. When Inflation falls below 2% or the Unemployment Rate is too high, the Fed can lower interest rates to encourage borrowing, which weighs on the Dollar.
How often does the Fed hold monetary policy meetings?
The Federal Reserve (Fed) holds eight monetary policy meetings a year, in which the Federal Open Market Committee (FOMC) assesses the economic situation and makes monetary policy decisions.
The FOMC is attended by twelve Fed officials: the seven members of the Board of Governors, the president of the Federal Reserve Bank of New York, and four of the eleven remaining regional Reserve Bank presidents, who serve for one year on a rotating basis.
What is Quantitative Easing (QE) and how does it affect the USD?
In extreme situations, the Federal Reserve may resort to a policy called Quantitative Easing (QE). QE is the process by which the Fed substantially increases the flow of credit in a stuck financial system. It is a non-standard policy measure used during crises or when inflation is extremely low. It was the weapon of choice for the Fed during the Great Financial Crisis of 2008. It consists of the Fed printing more dollars and using them to buy high-quality bonds from financial institutions. QE tends to weaken the US dollar.
What is Quantitative Tightening (QT) and how does it affect the US Dollar?
Quantitative tightening (QT) is the reverse process of QE, whereby the Federal Reserve stops buying bonds from financial institutions and does not reinvest the principal of maturing bonds in its portfolio to buy new bonds. It is usually positive for the value of the US dollar.
Source: Fx Street
I am Joshua Winder, a senior-level journalist and editor at World Stock Market. I specialize in covering news related to the stock market and economic trends. With more than 8 years of experience in this field, I have become an expert in financial reporting.


