
- GBP/CAD is breaking out of its rising and declining wedge pattern.
- It will likely continue towards the pattern’s bearish objectives.
GBP/CAD is decisively breaking out of a rising wedge pattern and declining quite quickly.
GBP/CAD Daily Chart
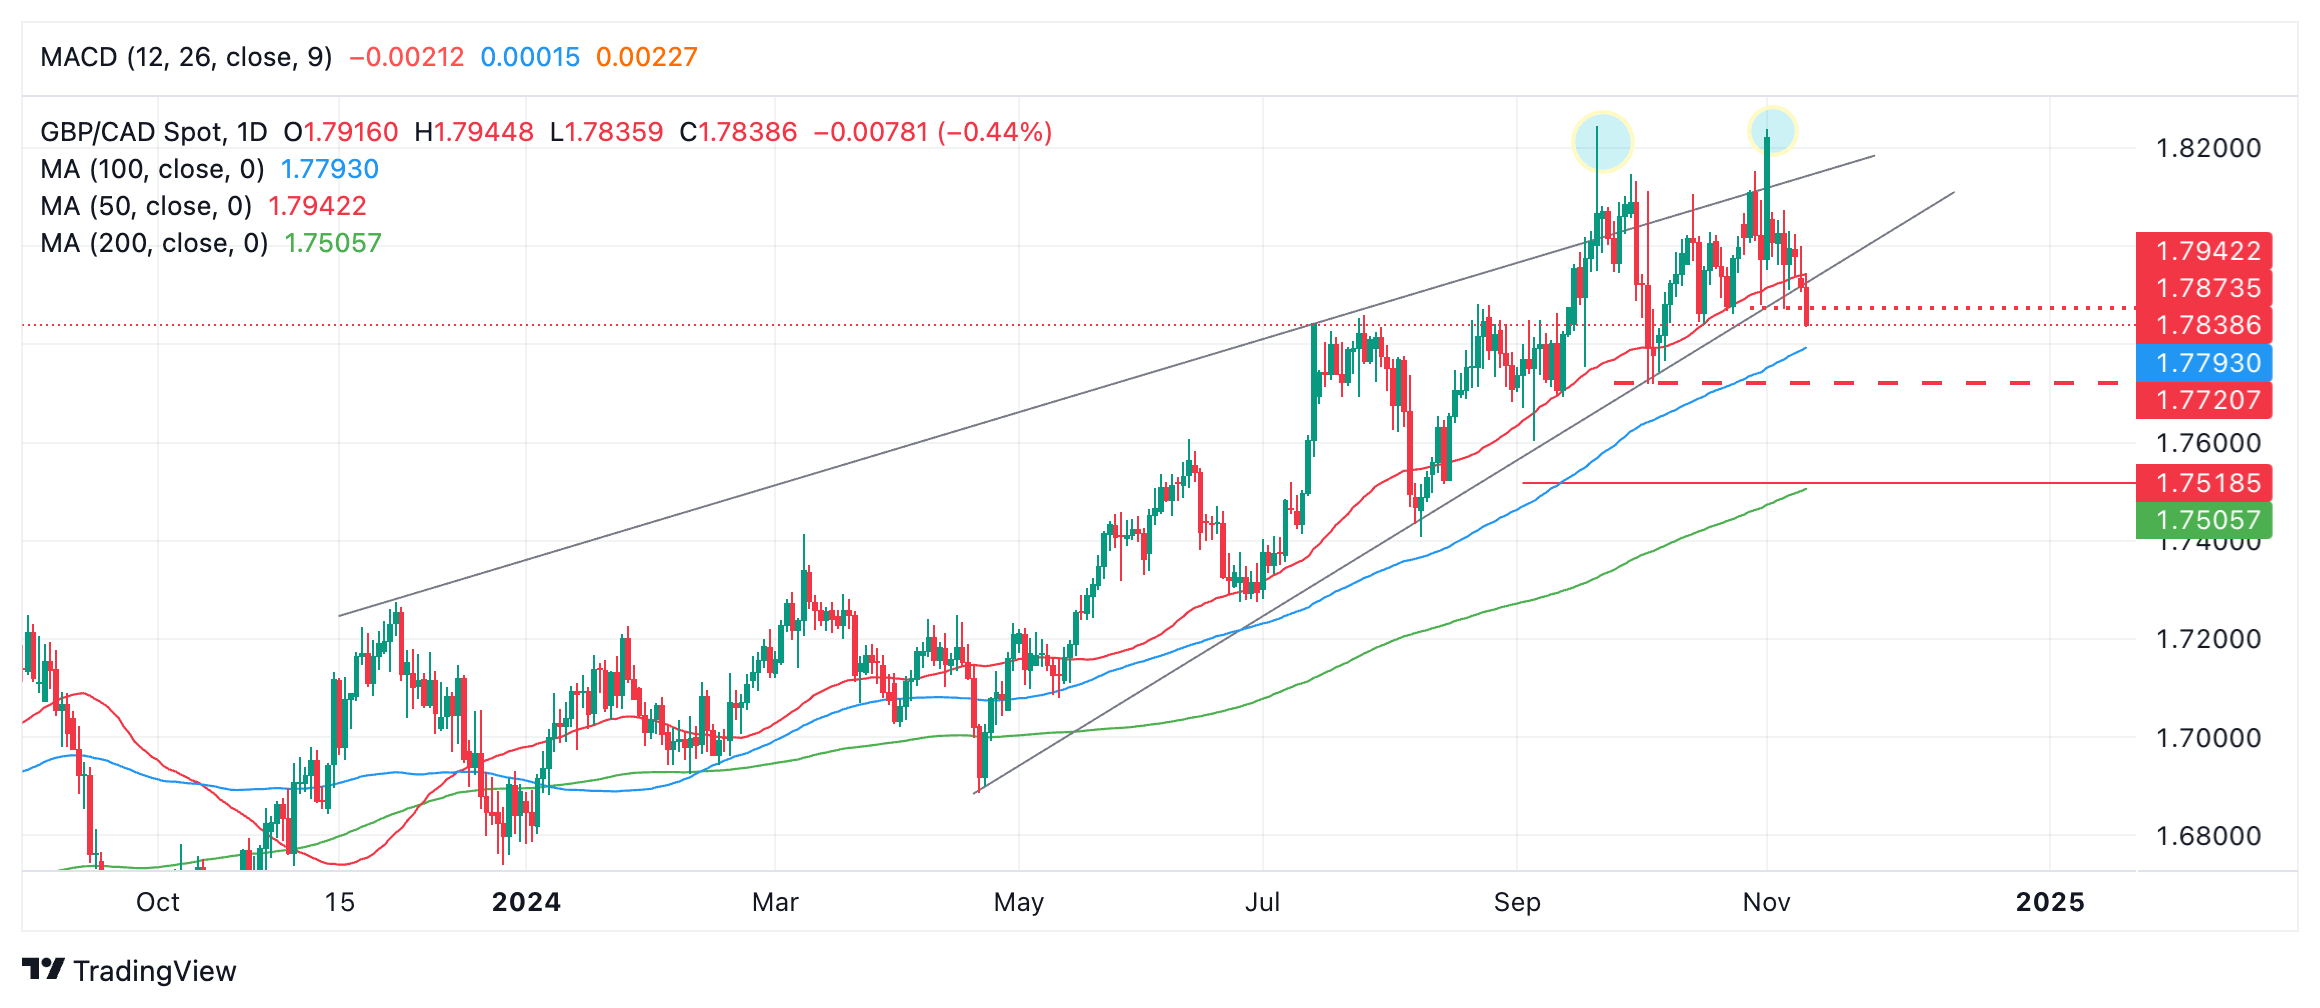
It has broken 1.7871, the November 6 low, indicating a likely confirmed breakout. The next downside target is 1.7719, the October 3 low.
A break below that would likely initiate further weakness towards the next target at 1.7518, the 61.8% width of the ascending wedge at its widest part extrapolated downward. This is the usual technical method for forecasting breakouts.
GBP/CAD temporarily broke above the upper rail of the rising wedge pattern on several occasions (blue circles on the chart) on September 20 and November 1. This is a sign of bullish exhaustion and an early warning of an impending reversal.
Source: Fx Street
I am Joshua Winder, a senior-level journalist and editor at World Stock Market. I specialize in covering news related to the stock market and economic trends. With more than 8 years of experience in this field, I have become an expert in financial reporting.


