
- GBP/CAD falls to the lower boundary of a bearish price pattern.
- A clear break lower could signal the start of a new downtrend cycle.
GBP/CAD falls to the lower boundary line of a Rising Wedge pattern and to the level of the 50-day SMA (red) at around 1.7826. Ascending Wedges are usually bearish patterns, however, there is no way to confirm that this is such a pattern, although it looks very similar to one.
GBP/CAD Daily Chart
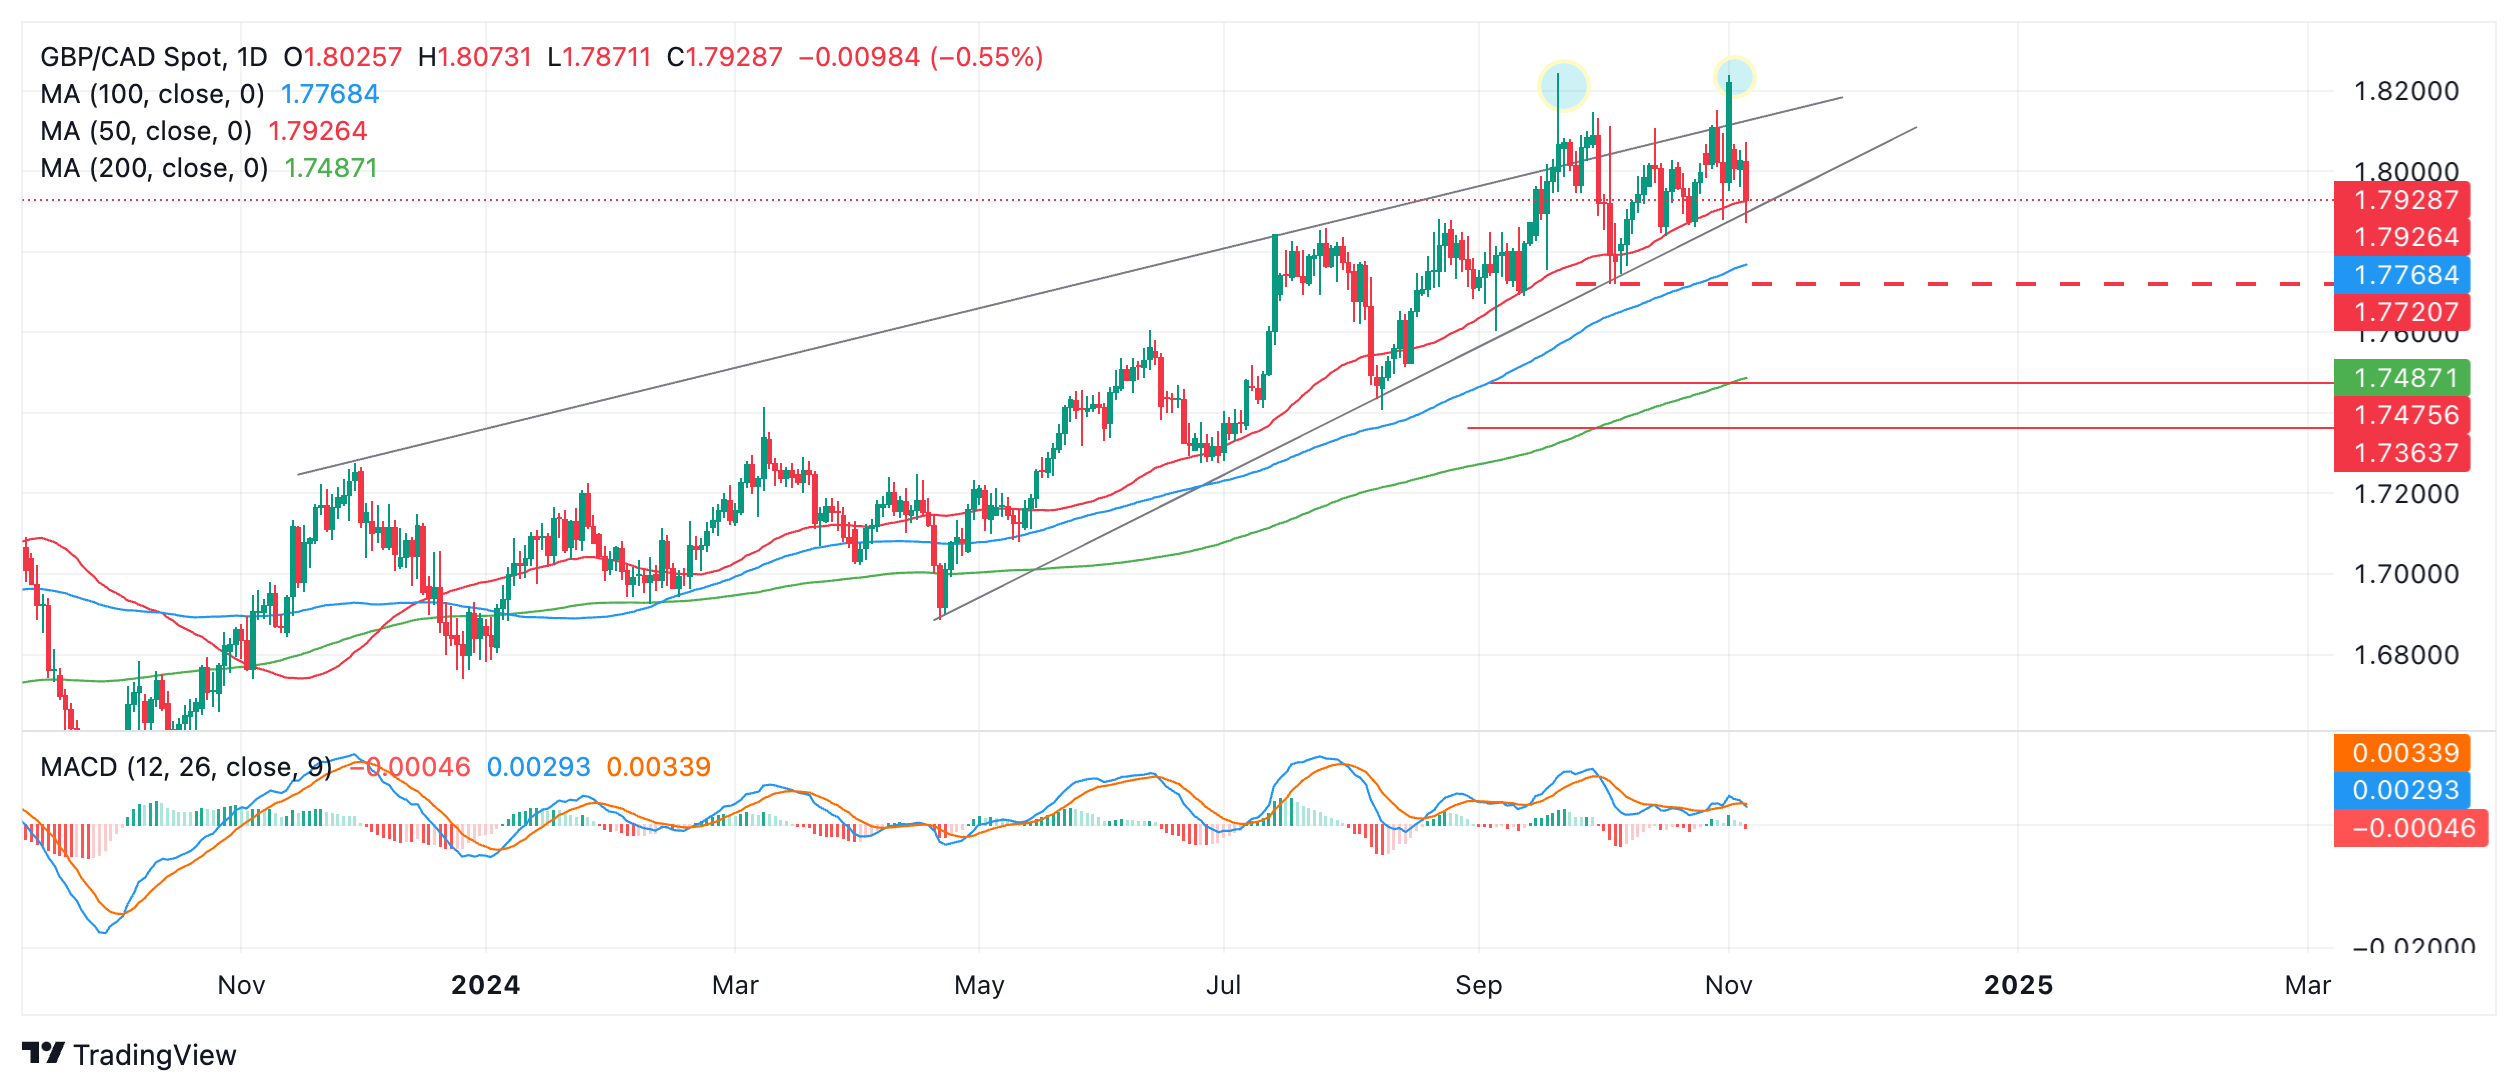
A decisive break below the lower boundary line could see a fall to the 200-day SMA level around 1.7487. Further downtrend could lead to a move lower to a target at 1.7364.
A break below the dashed red line on the chart at the key October 3 swing low at 1.7719 would provide stronger confirmation of a breakout and reversal in the medium-term uptrend.
GBP/CAD temporarily broke above the upper rail of the Rising Wedge pattern on several occasions (blue circles on the chart) on September 20 and November 1. This could be a sign of bullish exhaustion and an early warning of an impending reversal.
The Moving Average Convergence/Divergence (MACD) momentum indicator has been flat recently, but appears ready to break lower, a slightly bearish signal on the chart.
Source: Fx Street
I am Joshua Winder, a senior-level journalist and editor at World Stock Market. I specialize in covering news related to the stock market and economic trends. With more than 8 years of experience in this field, I have become an expert in financial reporting.


