
- The GBP/JPY pair is trading in the 181.50 area, the lowest of the week.
- The British pound lost ground this week following the Bank of England’s dovish turn.
- The BOJ continues to maintain its expansionary monetary policy.
The pair GBP/JPY is approaching the area below 181.50 after the British pound (GBP) was unable to regain any significant ground since Thursday’s pullback. The pound has lost almost a percentage point this week.
The Bank of England (BoE) took a dovish stance on Thursday, maintaining its benchmark interest rate after UK inflation data came in much softer than expected earlier this week. For the moment, the Bank of England maintains its reference rate at 5.25%, and it seems increasingly likely that the cycle of rate hikes in the United Kingdom will never end.
The Bank of Japan (BOJ) also maintained its main interest rate, with a negative rate regime of -0.1%. The BOJ remains steadfast in its hyper-flexible monetary policy mechanisms, and is determined to try to keep Japanese inflation above 2%.
Japanese inflation is currently at the high end of policymakers’ target level, but Japanese inflation is expected to plummet in the coming months, and the BOJ is in no rush to start reversing its negative rate policy until the central bank is assured that inflation will remain above its minimum target.
The economic calendar for next week looks light during the first half of the week, and the only notable release on the data agenda will be the minutes of Tuesday’s BoJ meeting, which will reveal the Japanese central bank’s internal monologue about the interest rate decision that just happened.
GBP/JPY Technical Outlook
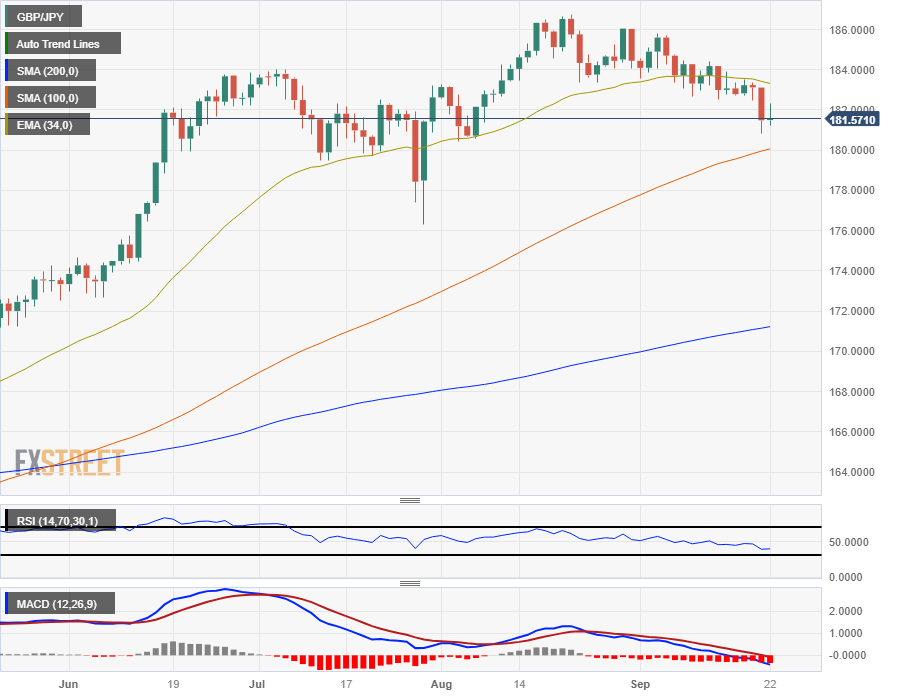
The GBP/JPY pair was unable to sustain the rebound gains and reached a high of 182.30 on Friday before settling lower, looking to establish a break of 181.50 to close the trading session for the week.
The pair remains firmly bearish below the 200 hourly simple moving average (SMA), which currently marks the resistance at 183.00.
Daily candles see the Guppy hesitant towards the 100-day SMA near the 180.00 area, and the pair has fallen almost 3% from the August high near 186.70.
Investors will be watching for sustained bearish momentum at the 100-day SMA, where a recovery could see a bounce towards the 34-day exponential moving average which is currently capping upside potential and sits just north of near-term highs. about 183.30.
GBP/JPY daily chart
GBP/JPY technical levels
Source: Fx Street
I am Joshua Winder, a senior-level journalist and editor at World Stock Market. I specialize in covering news related to the stock market and economic trends. With more than 8 years of experience in this field, I have become an expert in financial reporting.


