- GBP/JPY rebounded on Monday as investors shifted towards risk.
- UK jobs data and PMIs will be released on Tuesday.
- In Japan, the Tokyo CPI will be published to close the week.
GBP/JPY has reclaimed the 183.00 level in trading on Monday as broader market risk flows have become riskier, leading to a drop in safe havens such as the Japanese Yen (JPY), and has driven the relatively riskier British Pound (GBP) to record highs.
The Guppy is trading at its highest bids in over a week, landing just north of the 183.00 zone at 183.28 before a relief pullback drags the pair back down.
The Pound will need all the help it can get this week: with a quiet Monday, Tuesday will start strong.
Agenda for the week: UK Jobs, UK PMI, Tokyo CPI
First thing on Tuesday, at 06:00 GMT, the figures for the change in the number of job seekers and employment in the United Kingdom will be published; markets expect the number of jobless claimants to rise from 0.900 to 2,300, while the number of people in employment is expected to decline by 198,000, an improvement from the previous reading of -207,000, but still in negative territory .
UK Purchasing Managers’ Index (PMI) figures are also on the agenda for Tuesday at 08:30 GMT; Both services and manufacturing components are expected to improve slightly, with the composite PMI for October rising from 48.5 to 48.8.
On the yen side, the next round of inflation data in Japan will be released on Thursday at 23:30 GMT. Tokyo’s core Consumer Price Index (CPI) last showed an annualized increase of 2.5%, and markets expect the CPI (minus volatile fresh food prices) to remain at that figure, at 2.5%. 5% for the year in October.
GBP/JPY Technical Outlook
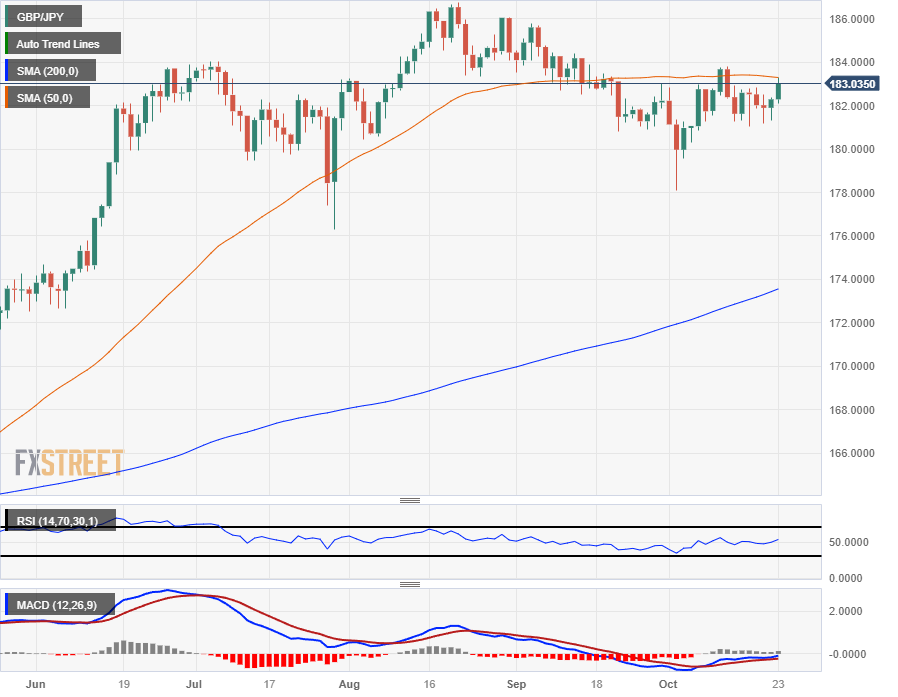
GBP/JPY is being dragged back towards the 50-day SMA on daily candlesticks as Monday’s six-day high pins the Guppy to medium-term averages.
The next high to beat will be the last swing high of 183.82 before bidders can again challenge the multi-year highs set in August beyond the 186.00 area.
The bottom is set at the lower end of the unexpected early October crash at 178.00, and the long-term outlook has GBP/JPY firmly buried at the upper end with the 200-day SMA leaning bullish, but well below the Current price action just below 174.00.
GBP/JPY Daily Chart

GBP/JPY Technical Levels
GBP/JPY
| Overview | |
|---|---|
| Latest price today | 183.04 |
| Today Daily Change | 0.75 |
| Today’s daily variation | 0.41 |
| Today’s daily opening | 182.29 |
| Trends | |
|---|---|
| daily SMA20 | 181.92 |
| daily SMA50 | 183.33 |
| SMA100 daily | 182.09 |
| SMA200 daily | 173.44 |
| Levels | |
|---|---|
| Previous daily high | 182.38 |
| Previous daily low | 181.3 |
| Previous weekly high | 182.81 |
| Previous weekly low | 181.02 |
| Previous Monthly High | 185.78 |
| Previous monthly low | 180.82 |
| Daily Fibonacci 38.2 | 181.96 |
| Fibonacci 61.8% daily | 181.71 |
| Daily Pivot Point S1 | 181.6 |
| Daily Pivot Point S2 | 180.91 |
| Daily Pivot Point S3 | 180.53 |
| Daily Pivot Point R1 | 182.68 |
| Daily Pivot Point R2 | 183.06 |
| Daily Pivot Point R3 | 183.75 |
Source: Fx Street
I am Joshua Winder, a senior-level journalist and editor at World Stock Market. I specialize in covering news related to the stock market and economic trends. With more than 8 years of experience in this field, I have become an expert in financial reporting.


