
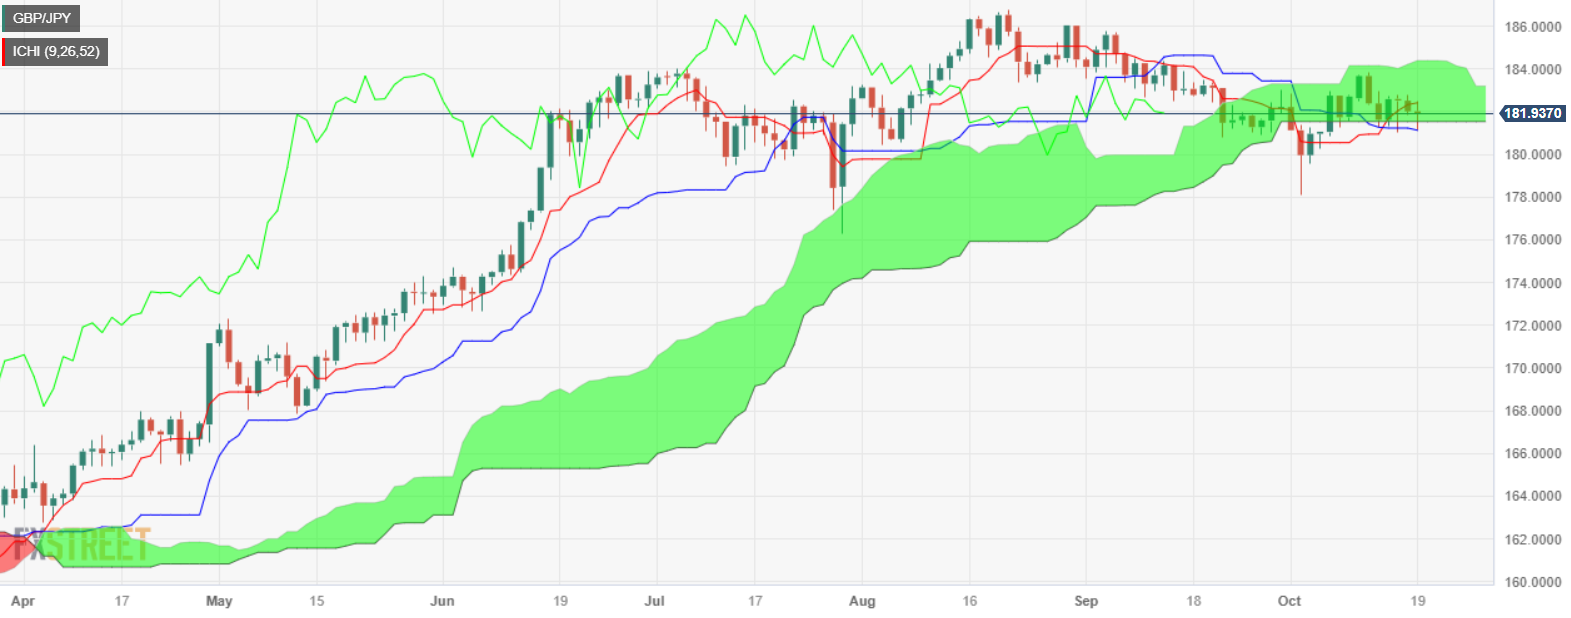
- The GBP/JPY daily chart shows the pair trading near the bottom of the Ichimoku (Kumo) cloud.
- Initial support is at 181.50/55; if it overcomes it, it could test 18.00 and the October 3 low at 178.31.
- First resistance at 182.00, followed by the week’s high at 182.81.
The pair GBP/JPY trended lower late in the New York session, after reaching a daily high of 182.51, although deteriorating sentiment encouraged outflows from the British Pound (GBP) towards the safe-haven Japanese yen (JPY). The pair is trading at 181.98, down 0.01%.
From a technical point of view, the GBP/JPY daily chart shows the pair weakening, trading within the Ichimoku (Kumo) cloud near the bottom of it. If the pair breaks through the initial support seen at 181.50/55, it will pave the way to test 18.00, followed by the October 3 low at 178.31. Further declines are expected to the daily level of July 28 and the latest cycle low at 176.30.
Conversely, the first resistance for GBP/JPY would be the 182.00 figure, followed by the current week’s high at 182.81. Additional upside risks lie above 183.00, such as the Kumo top around 184.50/75.
GBP/JPY Price Action – Daily Chart
GBP/JPY Technical Levels
Source: Fx Street
I am Joshua Winder, a senior-level journalist and editor at World Stock Market. I specialize in covering news related to the stock market and economic trends. With more than 8 years of experience in this field, I have become an expert in financial reporting.


