
- GBP/JPY extends its losses, going from around 163.00 to 160.60 in the last four days.
- Risk aversion in the forex space underpins safe haven pairs.
- GBP/JPY may resume its bearish bias below 160.34. Otherwise, a test of 162.07 is anticipated.
GBP/JPY stumbles and refreshes two-week lows, awaiting a break below the 6 Jul low of 160.38, which could exacerbate a move towards the 2 Aug low of 159.44, before falling to the 200 day EMA at 158.65. At time of writing, GBP/JPY is trading above 160.69, down 0.75%, due to risk aversion momentum in the forex space, to the detriment of currencies such as Pound, AUD and NZD .
GBP/JPY Price Analysis: Technical Outlook
The GBP/JPY long-term has a neutral bias to the downside, as the daily chart shows. A successive series of lower highs and lower lows, coupled with the Relative Strength Index (RSI) heading lower and below its RSI 7-day SMA, exacerbated the cross’s decline over the past four days. Also, the 20-day EMA is about to cross below the 100-day EMA at 162.97, which would put additional selling pressure on the pair. This could take GBP/JPY towards the 200 day EMA at 158.65.
Therefore, the GBP/JPY first support would be the August 15 low at 160.34. A break below would expose the Jul 6 low at 160.38, followed by the Aug 2 low at 159.44, followed by the aforementioned 200 day EMA.
On the other hand, the first resistance of the GBP/JPY would be the August 15 high at 162.07. Once broken, the next resistance will be the 12th August high at 162.79, followed by the 163.00 figure.
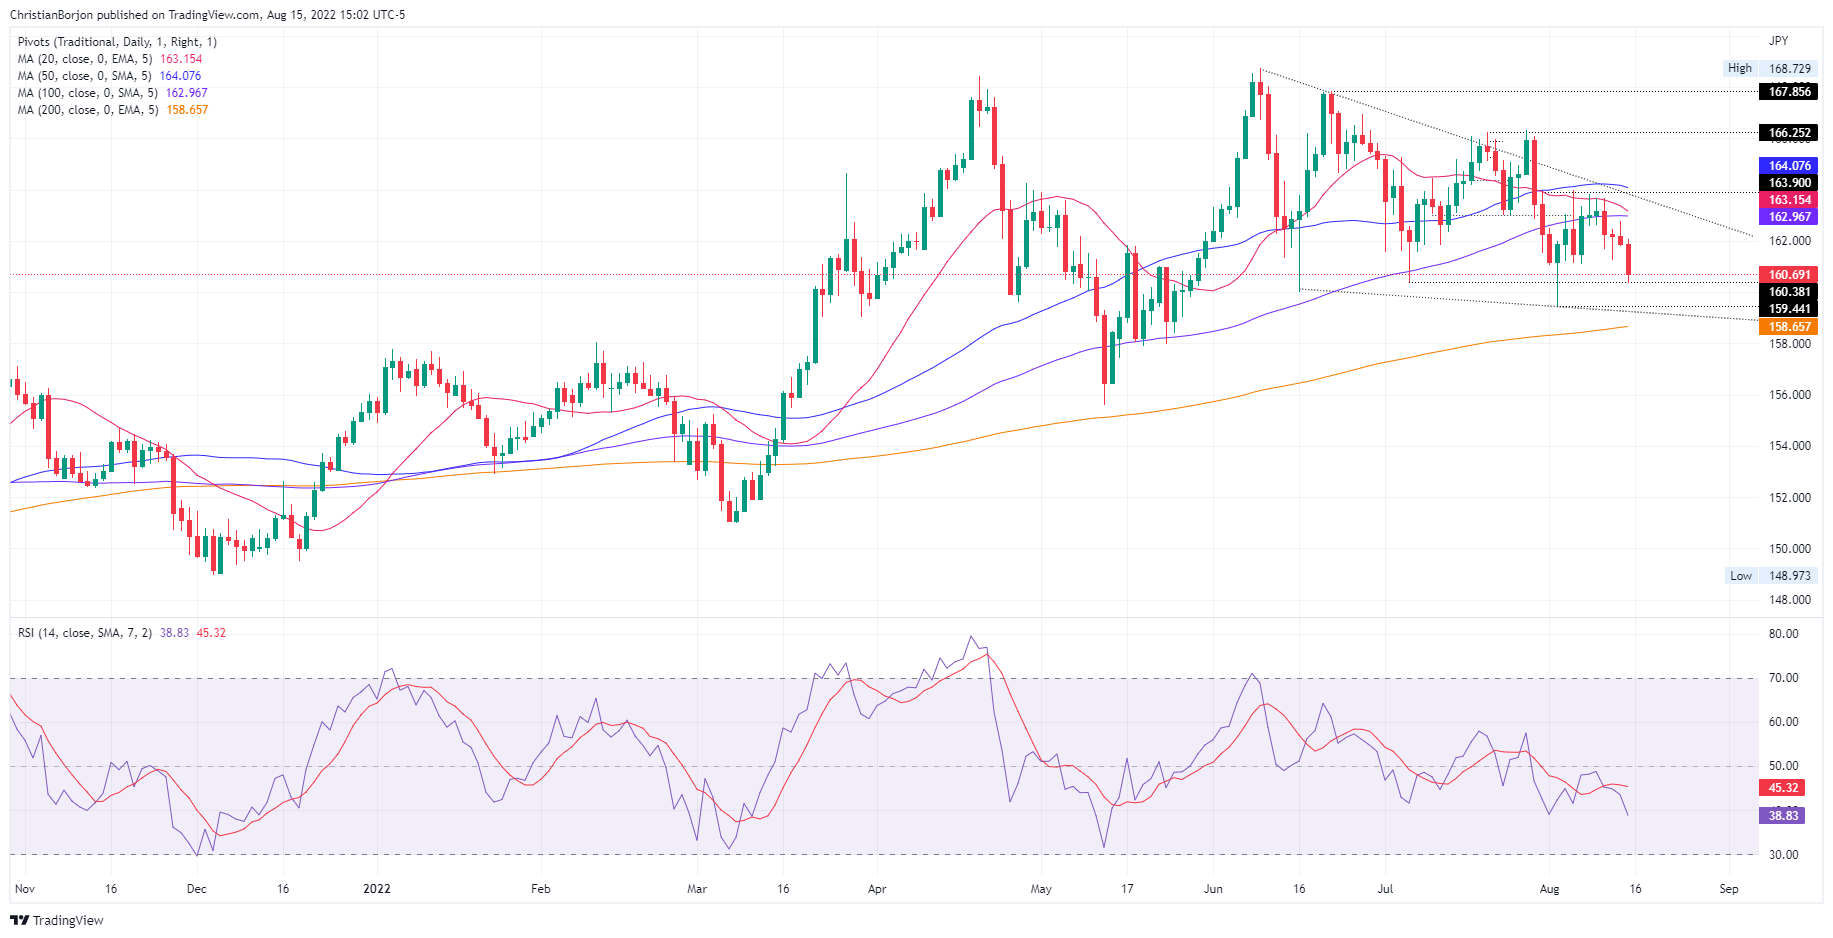 GBP/JPY daily chart
GBP/JPY Key Technical Levels
Source: Fx Street
With 6 years of experience, I bring to the table captivating and informative writing in the world news category. My expertise covers a range of industries, including tourism, technology, forex and stocks. From brief social media posts to in-depth articles, I am dedicated to creating compelling content for various platforms.


 on the water: her floating festival in Trieste is pure magic")

