
- The GBP/JPY uptrend appears to be overextended, with the next primary target set at the psychological level of 190.00, a high not seen since September 2008.
- A successful breakout of 190.00 could open the way towards the September 2008 high at 198.34, and potentially even towards the 200.00 level.
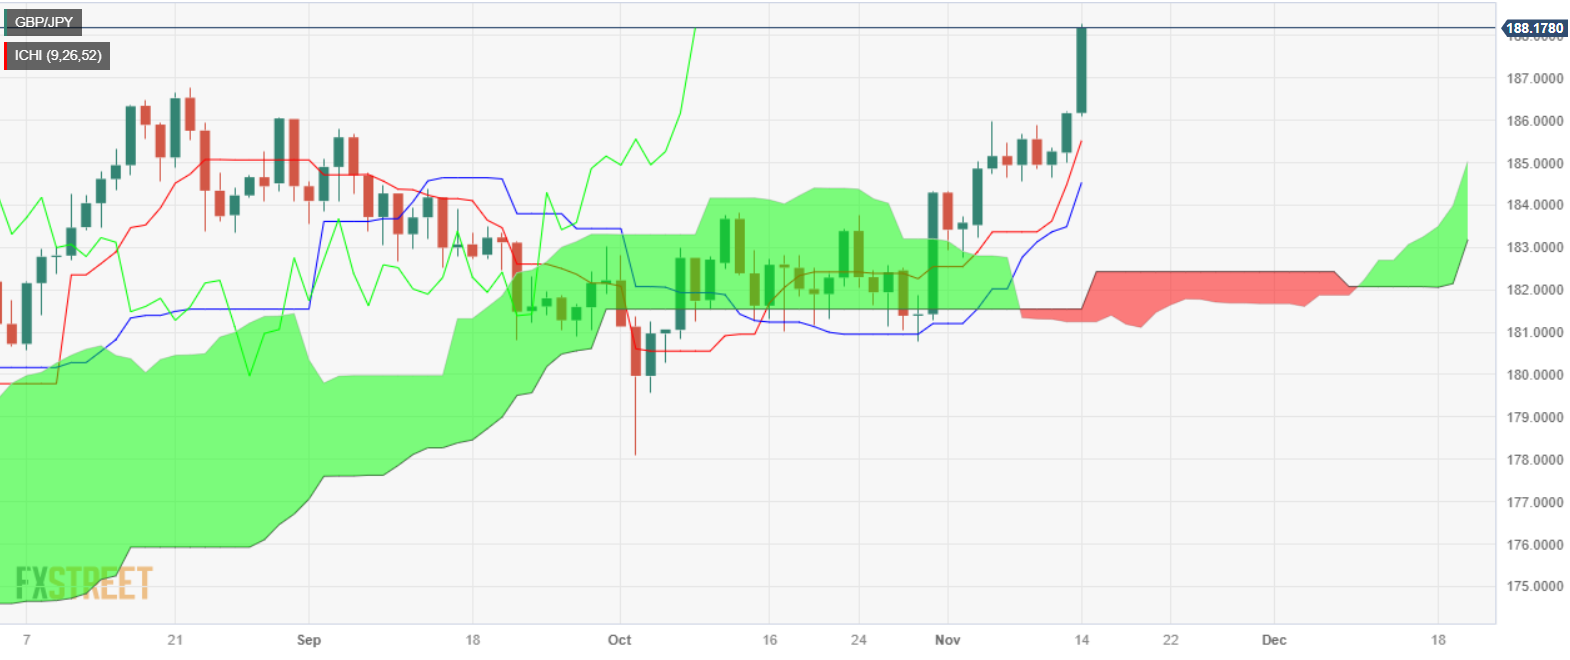
- On the downside, initial support is today’s low at 186.04, followed by the Tenkan-Sen at 185.50, the Kijun-Sen at 184.52 and the Senkou-Span A at 185.01.
In the middle of the North American session, GBP/JPY rebounded and regained eight-year highs around 188.28 on Tuesday, after US economic data sparked speculation that the Federal Reserve would not tighten its monetary policy further. Investors see this as a green light to buy riskier assets, to the detriment of the safe haven status of the Japanese Yen (JPY). The GBP/JPY pair is trading at 188.08, up more than 2%.
Given the aforementioned fundamental introduction, from a technical perspective, the GBP/JPY uptrend appears overextended, with buyers targeting 190.00, a level that has not been reached since September 2008. A break of the latter would immediately expose the high September 2008 at 198.34 before testing 200.00.
On the other hand, the first support for GBP/JPY lies at today’s low at 186.04, and once broken, the pair could fall to the Tenkan-Sen level at 185.50, followed by the Kijun-Sen at 184.52. Once broken, the next support would be the Senkou-Span A at 185.01.
GBP/JPY Price Analysis – Daily Chart
GBP/JPY Technical Levels
Source: Fx Street
I am Joshua Winder, a senior-level journalist and editor at World Stock Market. I specialize in covering news related to the stock market and economic trends. With more than 8 years of experience in this field, I have become an expert in financial reporting.


