
- GBP/JPY is moving sideways in the short term with a bearish bias.
- A daily close below 162.00 would open the door to more losses.
- Key resistance is seen at 163.70 and 164.50.
The GBP/JPY is falling on Tuesday, trading around 162.50. She has bottomed out at 161.85 and has quickly broken back above 162.00. The 162.00 area has become a critical level and a daily close below should open the door to an extension of the decline, initially to 161.20 (100 SMA). Below, there is not much support until 160.00.
Technical indicators on the daily chart are trending lower. RSI and Momentum are heading south, and the price is below the 20-day SMA. A recovery above 164.70 could change the short-term outlook.
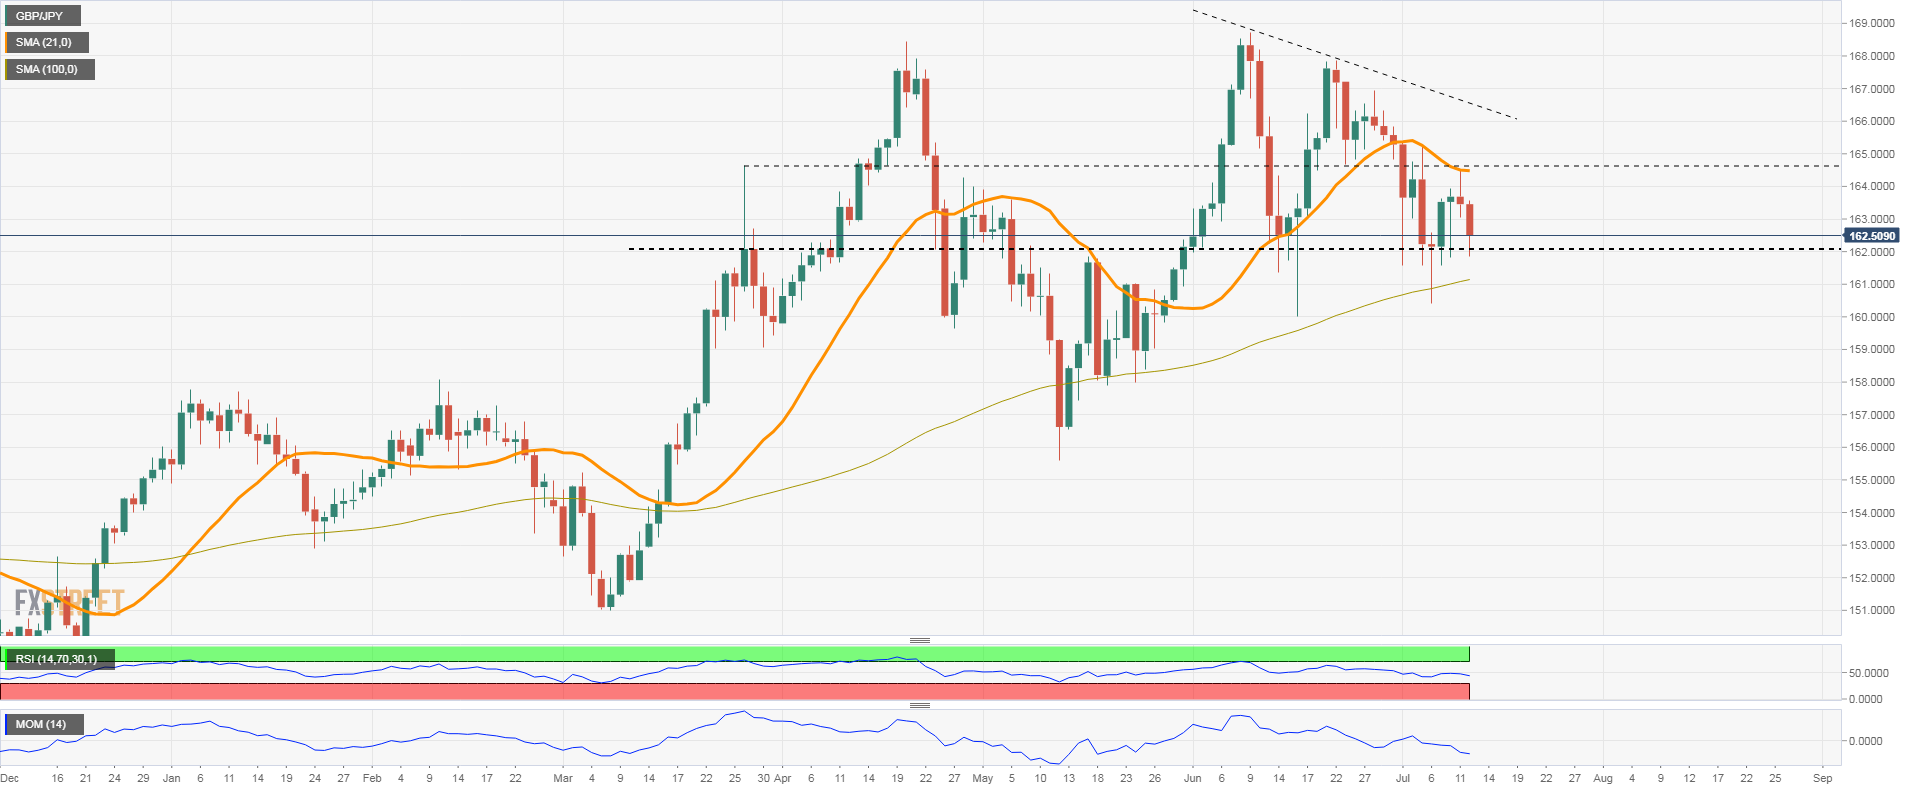
While the pound resists above 162.00, it will most likely continue to trade in a range between that level and 163.80. A daily close above the mentioned level should clear the way towards 164.70. The next critical target is the downtrend line from the June highs, currently at 166.55.
GBP/JPY daily chart
Technical levels
Source: Fx Street
With 6 years of experience, I bring to the table captivating and informative writing in the world news category. My expertise covers a range of industries, including tourism, technology, forex and stocks. From brief social media posts to in-depth articles, I am dedicated to creating compelling content for various platforms.


