
- Following the release of US inflation data, GBP/JPY plunges more than 100 points to the 169.00 area.
- The technical picture is bearish as the RSI points lower and the 3-day RoC turns negative.
The pair GBP/JPY Eases after hitting a daily high of 171.17 after safe-havens rallied following the release of US inflation data. GBP/JPY fell more than 100 pips towards the 169.00 zone as traders anticipate another interest rate hike by the Bank of England (BoE) in its struggle to curb inflation of around 10%.
GBP/JPY Price Analysis: Technical Perspective
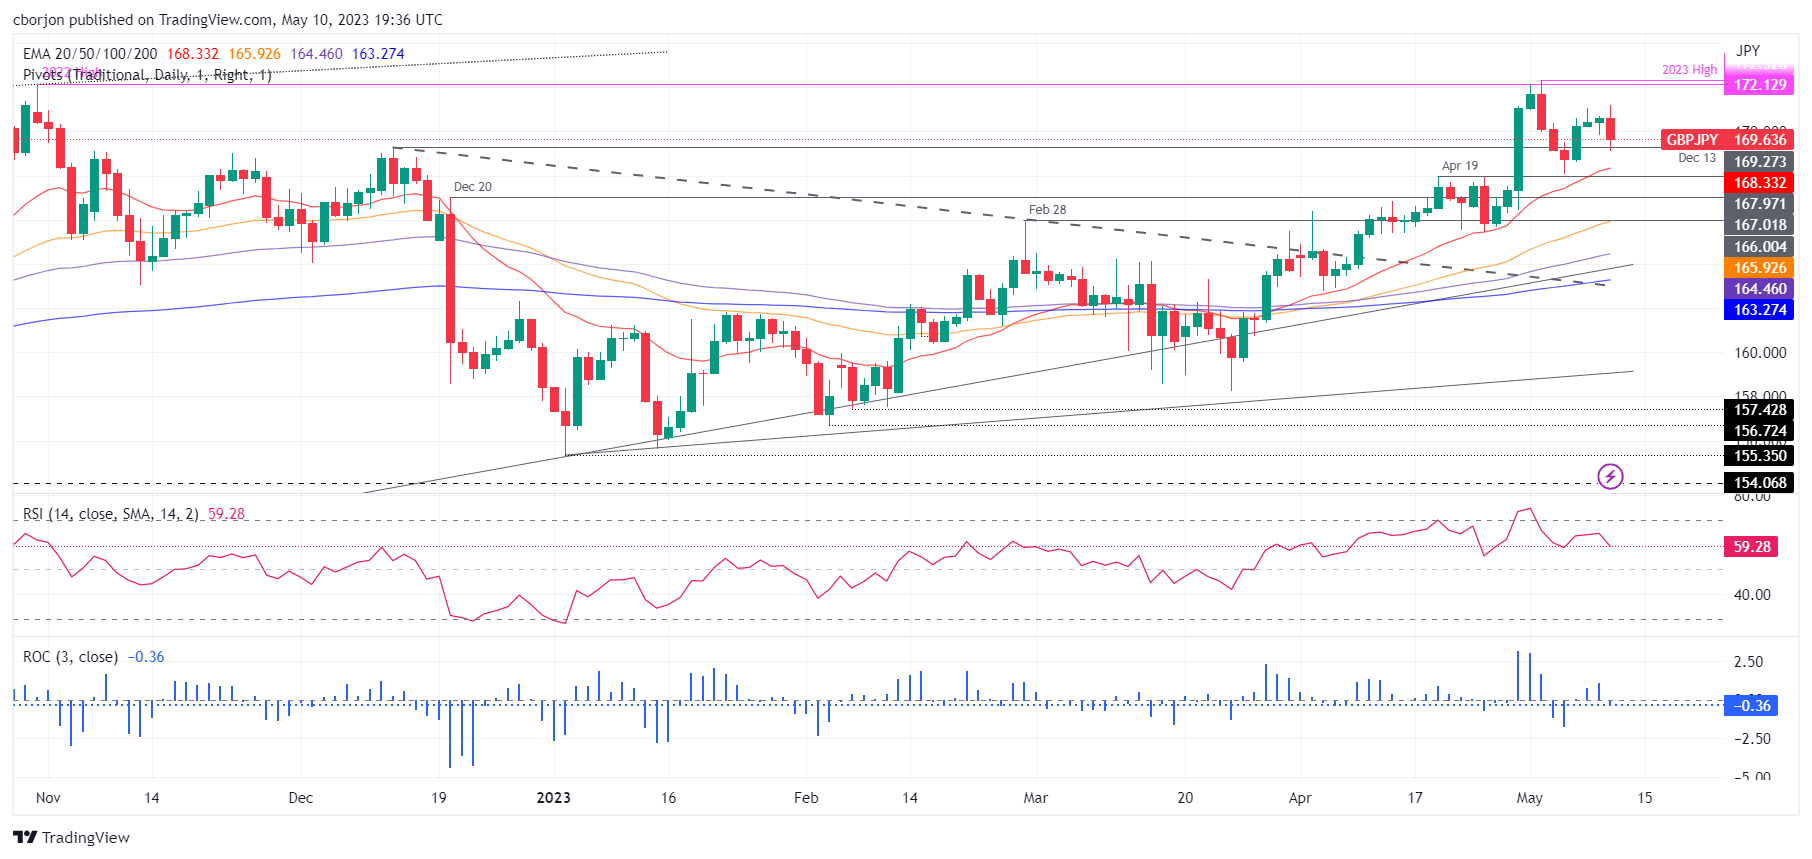
After three days of gains, the GBP/JPY pair fell towards the 169.50 zone, as the currency pair formed a bearish engulfing candlestick pattern. Although the Relative Strength Index (RSI) remains in bullish territory, it is still pointing lower, suggesting that buyers are running out of steam awaiting the Bank of England’s decision. The 3-day rate of change (RoC) turned negative, allowing sellers to enter new positions.
If the GBP/JPY pair falls below 169.00, the next support would be the 20-day EMA at 168.33, followed by the April 19 high at 167.97. Once broken, the next GBP/JPY demand zone would be the Dec 20 high turned support at 167.01.
On the other hand, if GBP/JPY recovers to the 170.00 zone, the next resistance would be the May 9 daily high at 170.71. A breakout of the latter zone would expose the GBP/JPY pair to a potential downside. A break of the latter would expose the May 10 daily high at 171.17, which once broken, could pave the way to test the year high at 172.13.
GBP/JPY Price Action – Daily Chart
Source: Fx Street
I am Joshua Winder, a senior-level journalist and editor at World Stock Market. I specialize in covering news related to the stock market and economic trends. With more than 8 years of experience in this field, I have become an expert in financial reporting.


