
- GBP/JPY fell 0.34%, trading at 185.80, influenced by a drop in the 10-year US Treasury yield.
- Despite the daily low of 185.52, GBP/JPY is poised to challenge the 187.00 signal amid possible Yen intervention.
- Short-term analysis shows support at Senkou Span B (185.50); a close below 186.00 could signal further declines.
The GBP/JPY pair makes a fresh year-to-date high but pulls back as the Japanese Yen (JPY) strengthens during the Tuesday session and remains the second strongest currency of the day. Falling US 10-Year Treasury Yields Weakened USD/JPY; hence the drop in GBP/JPY. At the time of writing these lines, GBP/JPY is trading at 185.80, down 0.34%.
GBP/JPY Price Analysis: Technical Perspective
From a daily chart perspective, GBP/JPY remains biased to the upside, although some buyers appear to be taking profits as Japanese authorities continue to talk of possible intervention to boost the Yen. Despite the drop to a daily low of 185.52, the pair is likely to test 186.00, followed by a challenge of the psychological level of 187.00.
In the near term, the hourly chart of GBP/JPY shows that the pair topped out around the fresh year high and pulled back below the Asian session low of 186.29, falling 70 points towards its daily low. It must be said that GBP/JPY’s decline was cushioned by Senkou Span B support around 185.50; since then, the currency pair has approached the confluence of the Ichimoku (Kumo) cloud top and the Tenkan-Sen line at 185.85. Once these levels are broken, the next stop would be the daily pivot point at 185.99. A daily close below 186.00 could pave the way for further losses.
GBP/JPY Price Action – Hourly Chart
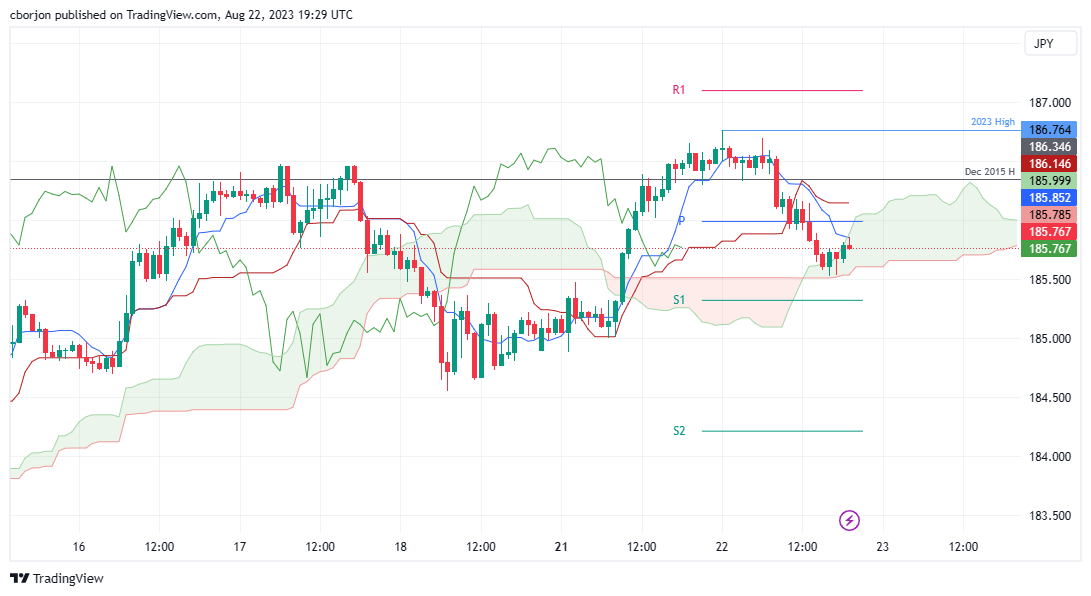
Source: Fx Street
I am Joshua Winder, a senior-level journalist and editor at World Stock Market. I specialize in covering news related to the stock market and economic trends. With more than 8 years of experience in this field, I have become an expert in financial reporting.


