
- GBP/JPY rises to 185.90, gaining more than 150 points, rising 0.88%, as US economic data reduces the likelihood of Fed rate hikes.
- The technical outlook shows that the pair broke above the Tenkan-Sen line, targeting the 186.00 level and potentially the year’s high of 186.76.
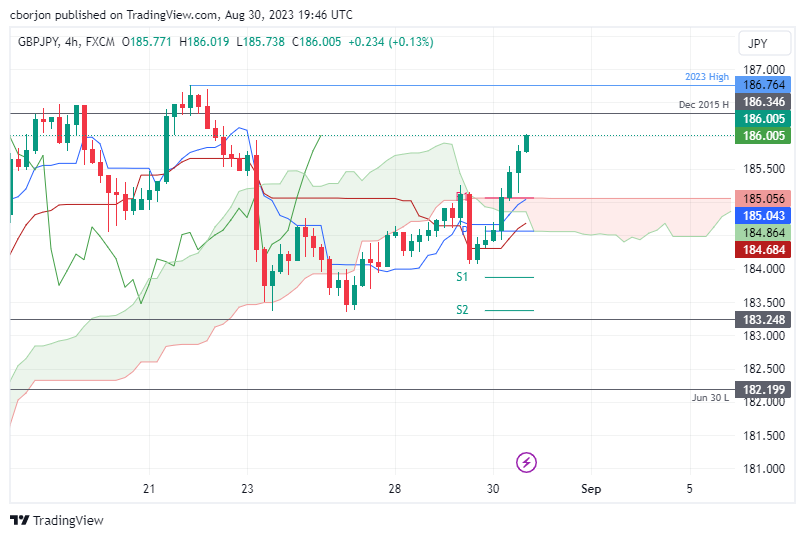
- The short-term 4-hour chart indicates a bullish bias, with first resistance at 186.00; bearish support is at 185.06, the confluence of the Tenkan-Sen and the top of the Kumo.
He GBP/JPY rallied strongly on Wednesday, gaining over 150 pips or 0.88% as market sentiment remains bullish, following the release of US economic data that could deter the US central bank from raise rates. The pair is trading at 185.90 after hitting a daily low of 184.31.
GBP/JPY Price Analysis: Technical Perspective
On Wednesday, the GBP/JPY broke above the Tenkan-Sen line, opening the door for further highs, bringing 186.00 into play, followed by a year-to-date high of 186.76. Conversely, a daily close below 186.00 could exacerbate a retest of the Tenkan-Sen line at 185.05, followed by the current week’s low at 183.35.
In the short term, the GBP/JPY 4-hour chart shows the pair biased to the upside, and after clearing the Ichimoku (Kumo) cloud, the cross is extending its gains. First resistance emerges at 186.00, followed by the December 2015 high at 186.35, before testing the year-to-date high at 186.76.
Conversely, if GBP/JPY turns lower, first support would emerge at 185.06, the confluence of the Tenkan-Sen and the top of the Kumo, followed by the Kijun-Sen line at 184.68.
GBP/JPY Price Action – Hourly Chart
Source: Fx Street
I am Joshua Winder, a senior-level journalist and editor at World Stock Market. I specialize in covering news related to the stock market and economic trends. With more than 8 years of experience in this field, I have become an expert in financial reporting.


