
- GBP/JPY loses 0.06% in a swing session.
- Sentiment remains negative, limiting GBP/JPY gains.
The GBP/JPY falls and trims Monday’s earnings on bearish sentiment in financial markets, prompted by US Walmart blaming inflation as the main reason for lowering its earnings forecast. Meanwhile, Russia has cut gas flows through Nord Stream 1, and EU countries have agreed to use less natural gas for the coming winter, reigniting recession fears in the bloc. At the time of writing, the GBP/JPY pair is trading at 164.39.
GBP/JPY Price Analysis: Technical Outlook
GBP/JPY has a neutral-upward bias, and the failure of sellers on Tuesday to make a daily close below the 20 and 50 day EMAs at 164.05 and 163.68, respectively, opened the door for further gains. Notwithstanding the above, buyers need to push the GBP/JPY rate further above the 3-month rising trend line, now resistance, around 165.00 to build the case for a rally to 166.00. Otherwise, GBP/JPY sellers will continue to wait to drag prices below 163.00 if they want to regain control.
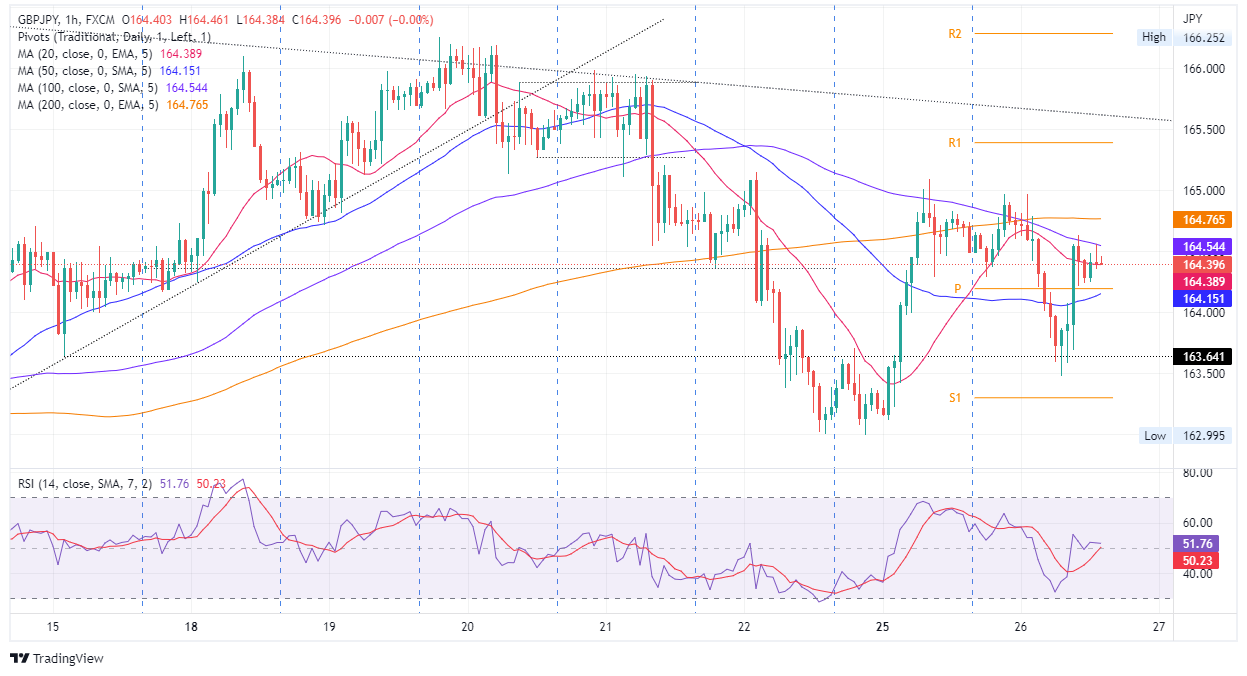
GBP/JPY 1 hour chart
The GBP/JPY 1 hour chart shows the currency pair with a neutral bias. On Tuesday, the price action of the pair turned down between the limits of Monday, which means that a bullish chart pattern is forming on the daily chart, which would open the door for further gains. However, on its way up, GBP/JPY’s first resistance would be the 100 hourly EMA at 164.54. A break above it will expose the 200 hourly EMA at 164.76, followed by the July 25 daily and weekly high at 165.08.
On the other hand, the first support for the GBP/JPY would be the 20-day EMA at 164.39. Once broken, the next support would be the intersection of the 20 hour EMA and the daily pivot around 164.15, followed by 164.00.
Technical levels
Source: Fx Street
With 6 years of experience, I bring to the table captivating and informative writing in the world news category. My expertise covers a range of industries, including tourism, technology, forex and stocks. From brief social media posts to in-depth articles, I am dedicated to creating compelling content for various platforms.


