
- GBP/JPY breaks two consecutive days of gains, down 0.01%.
- The GBP/JPY daily chart shows the pair in a range.
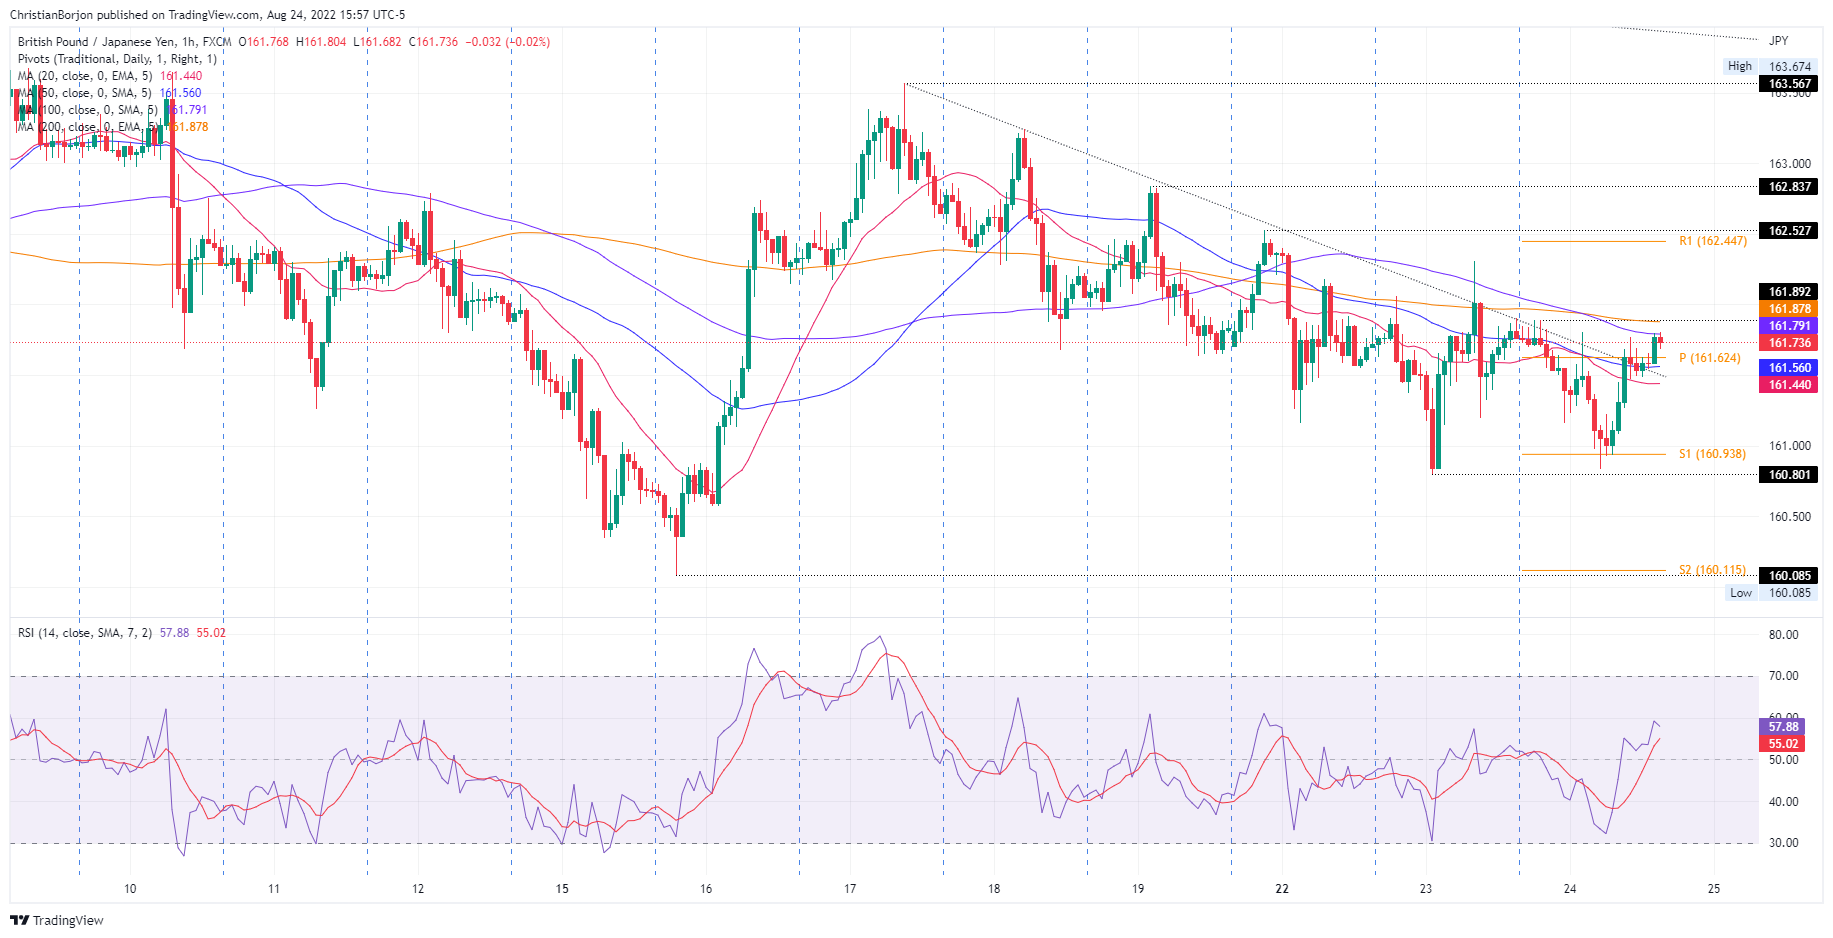
- GBP/JPY oscillates in the area of 161.00-162.30, unable to break out of the range.
The pair GBP/JPY is oscillating within a tight range for the third day in a row, although on Wednesday it failed to follow the last five days of successive series of lower highs and lower lows; however, indecision continues to haunt the currency pair. At the time of writing, the GBP/JPY pair is trading at 161.63, below its opening price.
On Wednesday, the currency pair opened near daily highs before falling sharply to daily lows at 160.08, at a time when market sentiment turned sour. However, the GBP/JPY pair maintained a rally and approached the 100 hourly EMA at 161.79, halting the pair’s recovery.
GBP/JPY Price Analysis: Technical Outlook
From a daily chart point of view, the GBP/JPY pair has been at low levels for the past four days. For the past three days, indecision surrounds the cross, further confirmed by the almost flat Relative Strength Index (RSI), despite residing below the mid-50 line.
In the short term, the hourly chart of the GBP/JPY shows a neutral bias. The exponential moving averages (EMA) on the hourly chart are within a tight range, below the exchange rate, except for the 100 EMA at 161.79. Therefore, the GBP/JPY trend is skewed to the upside, so a break above the latter would open the door for further gains.
Therefore, the first resistance of the GBP/JPY would be the 162.00 level. Once broken, the next resistance would be the R1 pivot at 162.44, followed by the 163.00 mark.
On the other hand, if the GBP/JPY falls below the 161.00 mark, it would open the way down. The first support would be the 160.50 mark, followed by the S2 daily pivot at 160.11, and then 160.00.
Technical levels
Source: Fx Street
With 6 years of experience, I bring to the table captivating and informative writing in the world news category. My expertise covers a range of industries, including tourism, technology, forex and stocks. From brief social media posts to in-depth articles, I am dedicated to creating compelling content for various platforms.


