
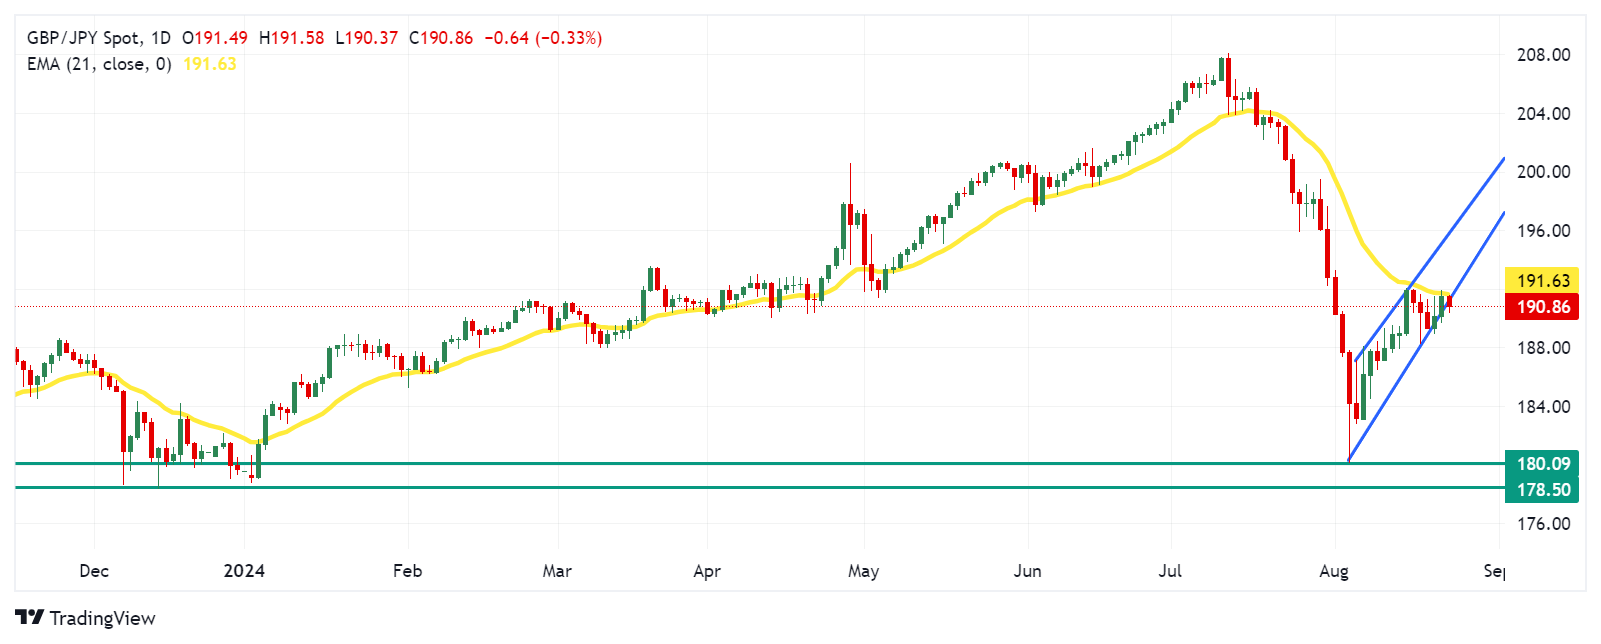
- GBP/JPY may find immediate resistance around the 21-day EMA at 191.63.
- Analysis of the daily chart indicates a potential weakening of the bullish bias.
- A break below the ascending channel could signal the emergence of a bearish bias.
GBP/JPY is retracing its recent gains from the previous two days, trading around the 190.90 level during the Asian session on Friday. The daily chart analysis indicates that the pair is attempting to break below the lower boundary of the ascending channel, suggesting a potential weakening of the bullish bias. Moreover, the 14-day Relative Strength Index (RSI) is positioned below the 50 level, indicating that bearish momentum is in play.
The MACD (Moving Average Convergence/Divergence) line is above the signal line, suggesting that there is some short-term bullish momentum. However, the MACD line is still below the zero line, signaling that the overall trend remains bearish. This could indicate a possible recovery or a temporary bullish move within a broader downtrend.
In terms of resistance, the 21-day EMA at the level of 191.63 appears as the immediate barrier. A break above the 21-day EMA could reinforce the bullish sentiment and support the GBP/JPY pair to explore the region around the upper boundary of the ascending channel at the level of 195.50.
On the downside, a successful break below the ascending channel could cause the bearish bias to emerge and put downward pressure on the GBP/JPY pair to navigate the area around the seven-month low at the level of 180.09, recorded on August 5. Additional support appears at the retracement support level at 178.50.
GBP/JPY: Daily Chart
Pound Sterling PRICE Today
The table below shows the exchange rate of the British Pound (GBP) against major currencies today. The British Pound was the weakest currency against the Japanese Yen.
| USD | EUR | GBP | JPY | CAD | AUD | NZD | CHF | |
|---|---|---|---|---|---|---|---|---|
| USD | -0.15% | -0.25% | -0.64% | -0.19% | -0.34% | -0.57% | 0.07% | |
| EUR | 0.15% | -0.10% | -0.47% | -0.05% | -0.20% | -0.20% | 0.21% | |
| GBP | 0.25% | 0.10% | -0.40% | 0.04% | -0.10% | -0.08% | 0.07% | |
| JPY | 0.64% | 0.47% | 0.40% | 0.42% | 0.28% | 0.27% | 0.46% | |
| CAD | 0.19% | 0.05% | -0.04% | -0.42% | -0.15% | -0.13% | 0.03% | |
| AUD | 0.34% | 0.20% | 0.10% | -0.28% | 0.15% | 0.02% | 0.17% | |
| NZD | 0.57% | 0.20% | 0.08% | -0.27% | 0.13% | -0.02% | 0.15% | |
| CHF | -0.07% | -0.21% | -0.07% | -0.46% | -0.03% | -0.17% | -0.15% |
The heatmap shows percentage changes of major currencies. The base currency is selected from the left column, while the quote currency is selected from the top row. For example, if you choose the British Pound from the left column and move along the horizontal line to the US Dollar, the percentage change shown in the chart will represent the GBP (base)/USD (quote).
Source: Fx Street
I am Joshua Winder, a senior-level journalist and editor at World Stock Market. I specialize in covering news related to the stock market and economic trends. With more than 8 years of experience in this field, I have become an expert in financial reporting.


