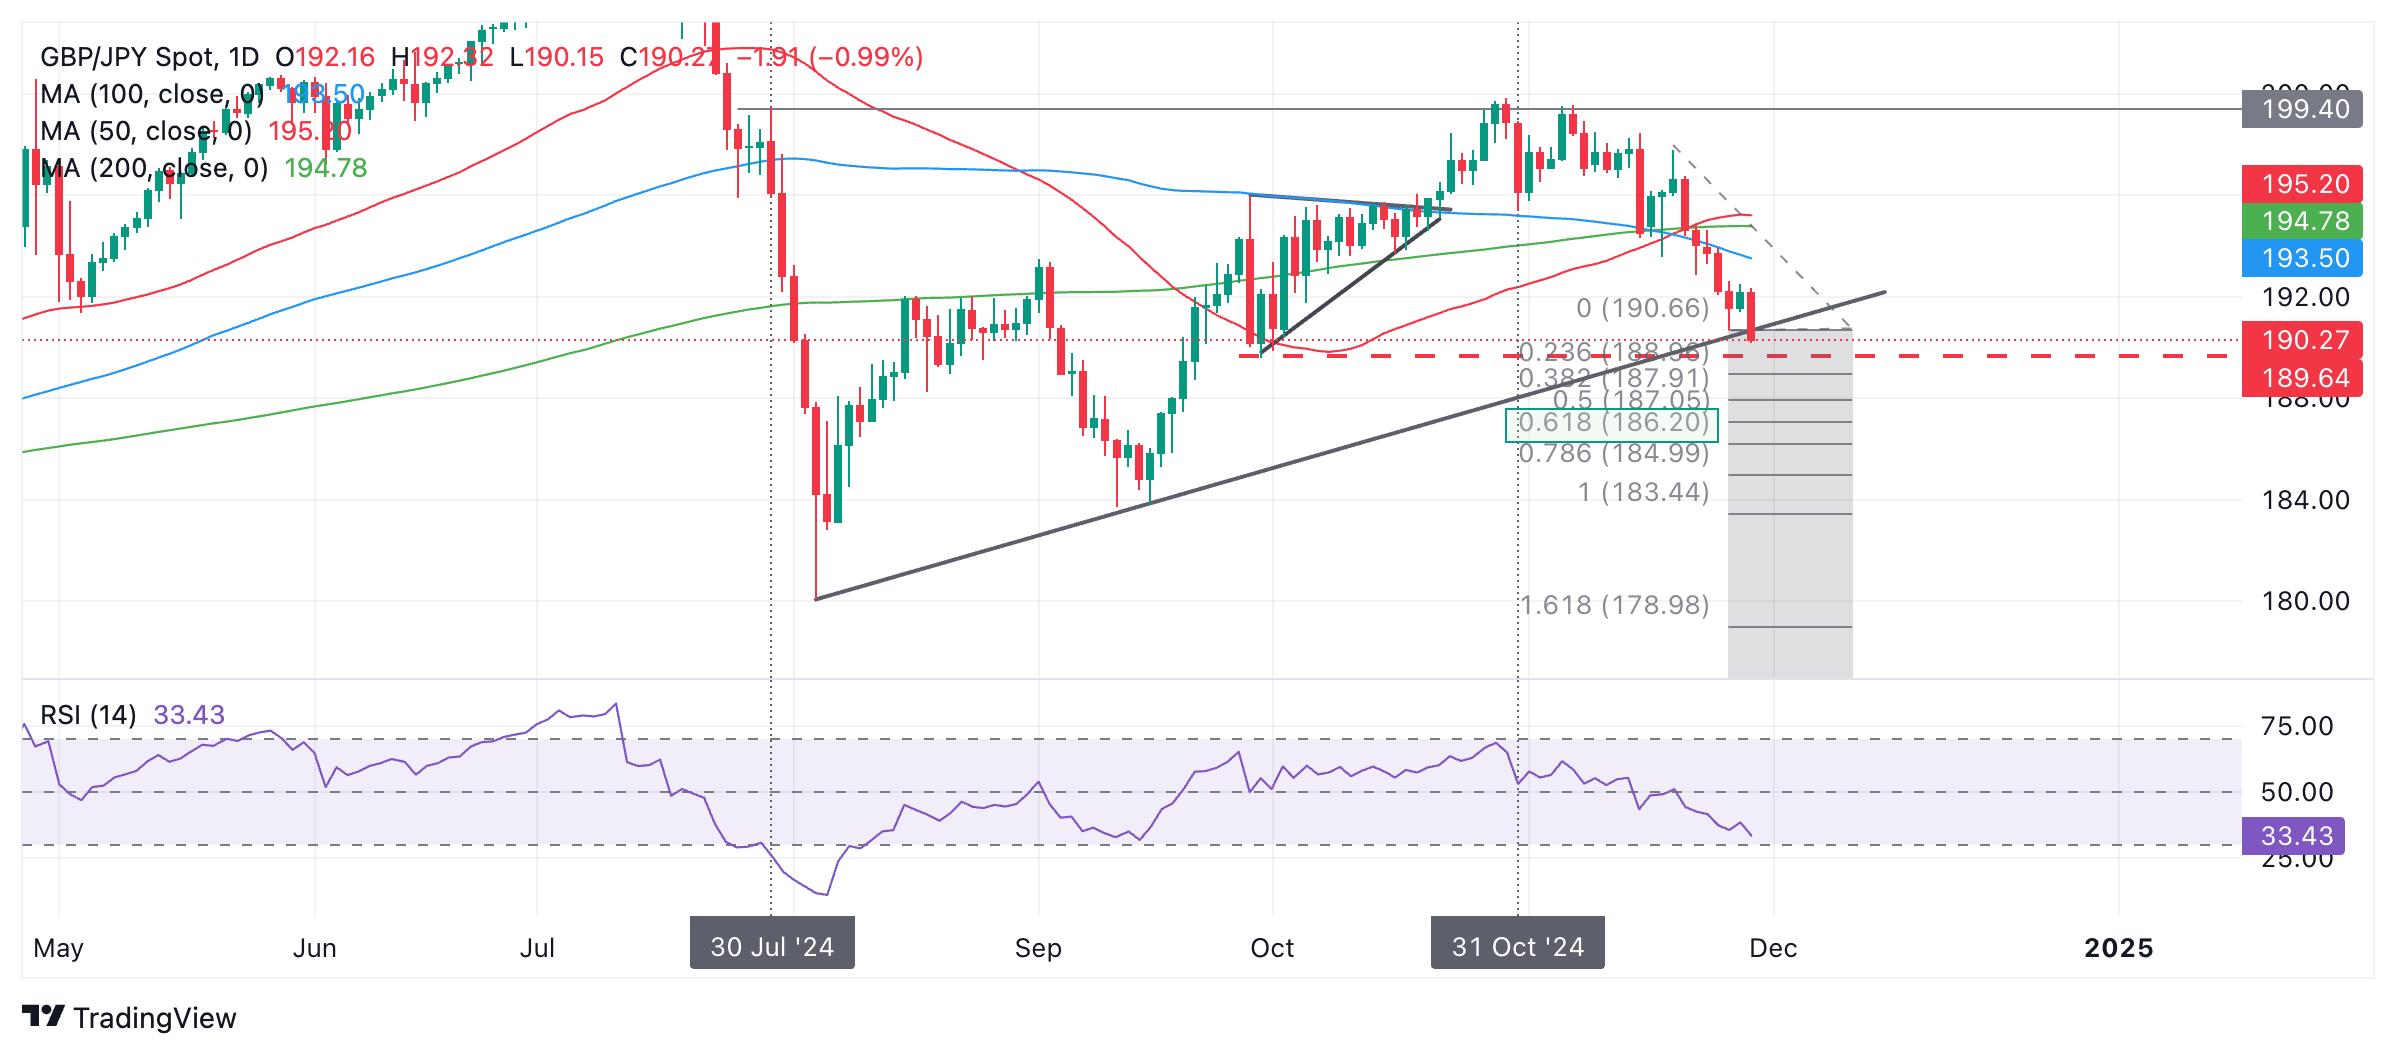
- GBP/JPY has fallen to a trend line for the August recovery.
- The pair is in a downtrend with odds favoring a downward extension.
GBP/JPY is attempting to pierce the trend line for the uptrend from the August lows. If it is successful and decisively breaks the trend line, it will suggest a downward continuation towards a new bearish target at 186.20, the 61.8% Fib of the downward move prior to the trend line (blue rectangle on the chart) .
The pair is now in a short and probably medium-term downtrend (from the October 31 high) and according to technical analysis theory, the trends tend to extend, suggesting that the probabilities favor even more declines to come. .
GBP/JPY daily chart
GBP/JPY is declining towards the pair’s next target around 189.56, the low of the right triangle that formed in late September and early October.
It is also possible that it will bounce from the current level on the trend line, which is a support level.
The Relative Strength Index (RSI) is not yet oversold, indicating that the pair could still fall further before being oversold.
A decisive break of the trend line would be one accompanied by a long red candle that closed near its lows and well away from the trend line, or three consecutive red candles that broke the level.
Source: Fx Street
I am Joshua Winder, a senior-level journalist and editor at World Stock Market. I specialize in covering news related to the stock market and economic trends. With more than 8 years of experience in this field, I have become an expert in financial reporting.


