
- GBP/USD recovers 1.2350 and overcomes three days of losses, ahead of US Retail Sales, IPC
- GBP/USD is up 0.33% on Monday, snapping three consecutive days of losses.
- GBP/USD Headwind, Depressed Market Mood and High US Treasury Yields.
- GBP/USD Price Forecast: Still Skewed To The Downside, But Could Flip To Neutral-Downside.
The GBP recovered some ground despite a risk-off environment in financial markets, while the dollar hit a 20-year high around 104,187 as market participants fly to their safe-haven peers. At the time of writing this article, the pair GBP/USD it trades at 1.2373.
Risk Sentiment and High US Treasury Yields Boost Dollar
Global equities are trading lower, while rising US Treasury yields underpin the dollar. Sentiment weakened courtesy of China’s slowest export report in almost two years, as a consequence of Covid-19 zero tolerance restrictions. GBP/USD traded at a new yearly low at 1.2260, but bounced off those levels and broke above the 1.2300 level, towards current levels. Meanwhile, the US Dollar Index, a gauge of the dollar’s value against a basket of its rivals, gained 0.49%, currently at 103.706.
Higher US Treasury yields reaffirm that market players are convinced that the Fed would bring inflation to its target and has priced in rate hikes of at least 200 bps by 2022. The week, which could provide some clues about the second quarter after first quarter GDP contracted 1.4%.
Some Fed speeches also added some downward pressure on the main. Atlanta Fed President Raphael Bostic said the Fed could go for two, “maybe three” half-point hikes, and then the Fed would assess the economy.
On the UK side, Bank of England Michael Saunders, one of three 50bp holdouts, emphasized his preference for moving relatively quickly, and there may be some further tightening. However, he added that he may not vote for a half-move in future meetings.
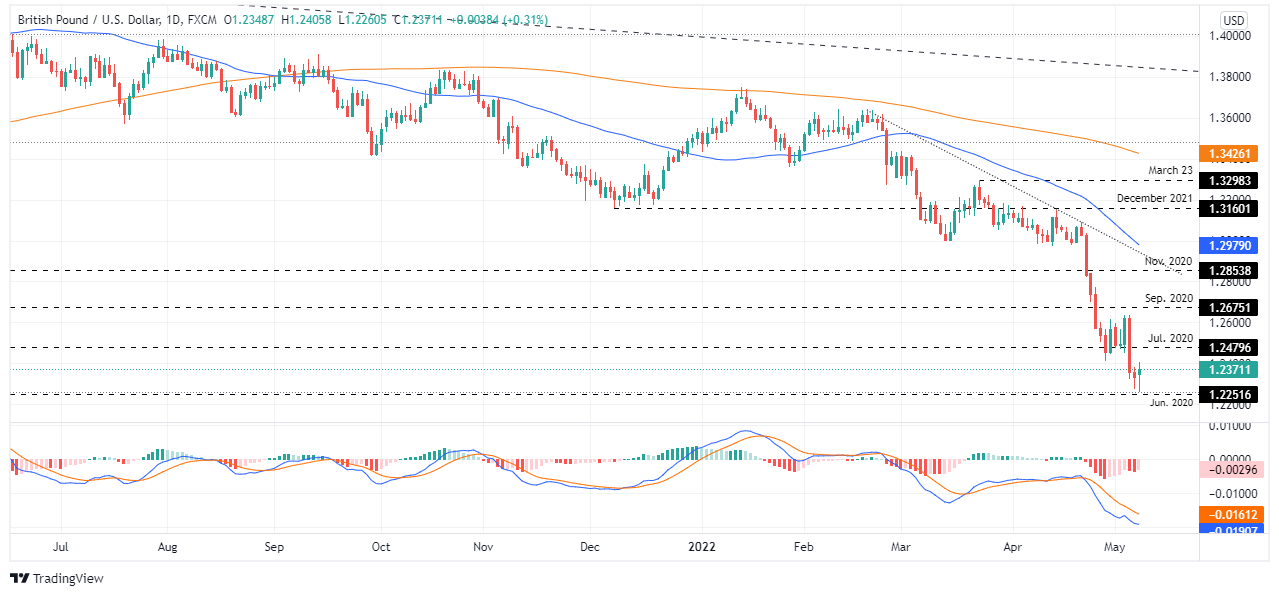
GBP/USD Price Forecast: Technical Outlook
GBP/USD remains biased to the downside, but Monday’s price action could herald a sideways move before resuming the downtrend or rallying. It is worth noting that the MACD histogram prints a positive divergence compared to the lower lows in the main’s price action, which means GBP/USD could post another push before hitting lower price levels.
To the upside, GBP/USD’s first resistance would be at 1.2400. Breaking above would expose the July 2020 cycle low at 1.2479, followed by 1.2500. On the other hand, the first GBP/USD support would be 1.2300. A break of the latter would expose the yearly low at 1.2260, followed by the May 2020 cycle low at 1.2075.
Technical levels
Source: Fx Street
With 6 years of experience, I bring to the table captivating and informative writing in the world news category. My expertise covers a range of industries, including tourism, technology, forex and stocks. From brief social media posts to in-depth articles, I am dedicated to creating compelling content for various platforms.


