
- GBP/USD is trading at 1.2710, up 0.58%, buoyed by weaker-than-expected US jobs data and a downward revision to Q2 GDP to 2.1%.
- The US Dollar Index (DXY) fell 0.38% to 103.089, further boosting sterling as US Treasury yields also fell.
- Bank of England rate hike forecasts and a report showing UK consumer debt containment support the pound.
The British Pound (GBP) advances for three consecutive days against DUS dollar (USD) amid a light economic calendar in the UK. A busy economic week for the United States (US), especially tilted towards the jobs data, lowered the chances that the Federal Reserve will raise rates in the remainder of the year. GBP/USD is trading around 1.2710, 0.58% above its opening price.
GBP/USD advances for the third day in a row, after dismal US jobs data, GDP numbers reduced expectations for a Fed rate hike.
Following Tuesday’s worse-than-expected job vacancies report, the ADP National Employment Report for August was no exception. The data showed companies hired fewer than estimated 195,000 and added 177,000 jobs to the economy, indicating the labor market is losing traction. Speculation that the Fed would not raise borrowing costs could be reflected in the CME’s FEdWatch tool, with investors trimming their bets for a November rate hike.
Other data showed that the economy is deteriorating, with the second estimate of Gross Domestic Product (GDP) for the second quarter at 2.1%, below the previously reported 2.4%, a sign that the economy is slowing.
GBP/USD reacted higher and pierced the 1.2700 level, which had been broken lower on August 24, and the pair ended the session around 1.2591. However, data from the past few days lifted sterling, while the dollar bleeds as US Treasury yields fall.
The US Dollar Index (DXY), which tracks six currencies against the dollar, posted losses of 0.38% to 103,089.
On the other side of the pond, additional rate hikes planned by the Bank of England (BoE) underpin the Cable. Market participants estimate that the Bank Rate would reach a maximum of around 5.8%. Meanwhile, a BoE report showed that British consumers increased their loans less than expected, as higher rates affect their citizens.
Apart from this, upcoming data from the US, particularly the Federal Reserve’s preferred indicator for inflation, Personal Consumption Expenditures (PCE), and other labor market data should give GBP/USD direction.
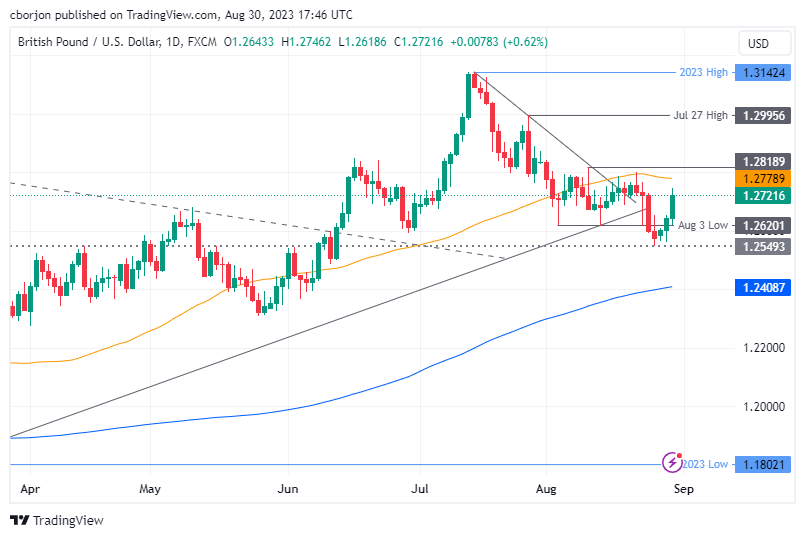
GBP/USD Price Analysis: Technical Insights
With the GBP/USD rallying above 1.2700, the pair is ready to test the 50-day moving average (DMA) at 1.2779 in the short term, followed by the 1.2800 figure. If these two resistance levels are broken, the next target could be the daily high on July 27 at 1.2995. Conversely, if the pair falls below 1.2700, expect a further pullback to the current week’s low at 1.2548.
Source: Fx Street
I am Joshua Winder, a senior-level journalist and editor at World Stock Market. I specialize in covering news related to the stock market and economic trends. With more than 8 years of experience in this field, I have become an expert in financial reporting.


