
- GBP/USD marks a three-day uptrend, gaining 0.14%, trading at 1.2740 within a 1.2702/1.2787 range.
- UK data this week, including unemployment and inflation figures, support GBP/USD, hinting at a possible Bank of England rate hike.
- US data: Initial jobless claims at 239,000, better than expected; the Philadelphia Fed manufacturing index for August shows an improvement.
The British Pound (GBP) extends its uptrend to three straight days, as seen by GBP/USD gaining 0.14%, despite market sentiment souring as global bond yields have risen. uploaded. Expectations that central banks will keep borrowing costs higher for longer are taking their toll on stocks. GBP/USD is trading at 1.2740 after swinging from a low to a high of 1.2702/1.2787.
Pound Benefits from Positive UK Data as US Treasury Yields Cap Gains for Pair
Data for the current week has supported GBP/USD, although it remains constrained by rising US Treasury yields. Although the UK unemployment rate stood at 4.2%, above the 4% forecast, rising wages increased the chances of a Bank of England (BoE) rate hike. Data on Wednesday bolstered this further as while UK inflation slowed as expected to 6.8% yoy, core inflation beat forecasts of 6.8% and rose to 6.9%. Consequently, GBP/USD advanced.
Separately, the US Bureau of Labor Statistics (BLS) reported that jobless claims last week rose to 239,000, below estimates of 240,000, continuing to reflect market strength. labor. At the same time, the Philadelphia Fed revealed that its August manufacturing index came in at 12, improving above the -10 contraction expected by analysts.
On Wednesday, the Fed released minutes from its July meeting, showing that Fed members continue to see upside risks to inflation, suggesting further tightening may be necessary. However, they would take into account the upcoming data for the following meetings. Notably, Fed officials have expressed the need to stop raising rates, led by some regional Fed chairmen such as Bostic, Goolsbee, Harker and Barkin.
Following Wednesday’s data release, the Atlanta Fed’s GDPNow model puts US GDP for the third quarter of 2023 at around 5.8%, up from 4.1% on August 8. In view of these data, the swap market has shown an increase in the chances of a 25 basis point rate hike by the Federal Reserve at the next meeting in November.
The pound is trading slightly higher near $1.2750 but remains on track to test the late June low near $1.2590.
What to expect?
The US economic calendar will be empty, while the UK will release Gfk Consumer Confidence along with July Retail Sales.
GBP/USD Price Analysis: Technical Perspective
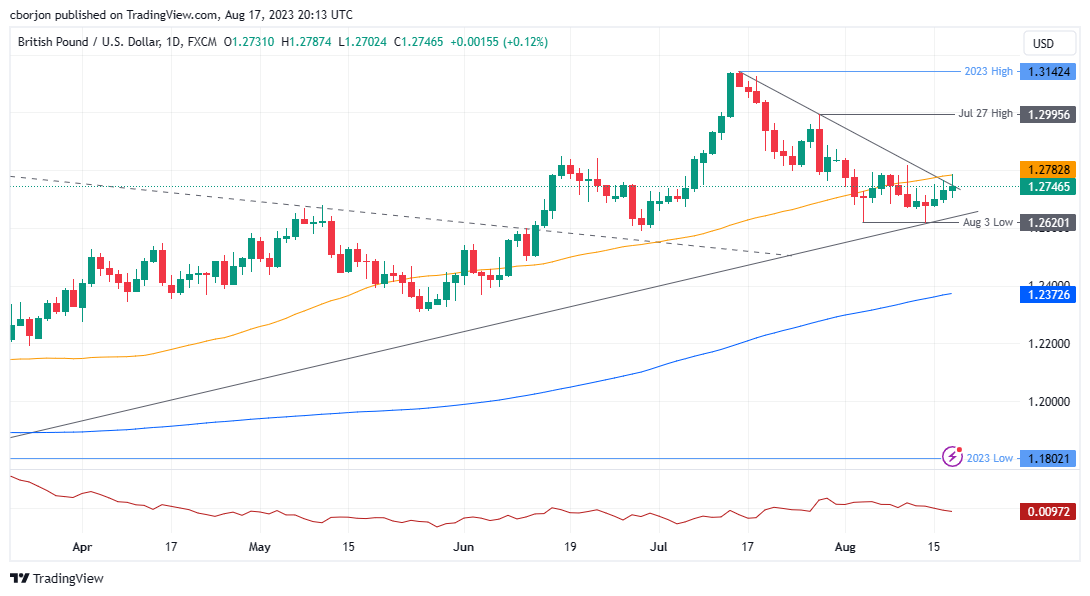
The GBP/USD daily chart shows that the pair bottomed out around 1.2620 and remains biased higher, but limited by technical indicators. At time of writing, the GBP/USD pair remained below a downtrend resistance trend line and tested the 50-day moving average (DMA) at 1.2782, two levels aggressively defended by sellers. If GBP/USD fails to conquer 1.2800, the path of least resistance could push the price towards a weekly low of 1.2620. Otherwise, if GBP/USD recovers to the 50 DMA, 1.2800 would be in play.
Source: Fx Street
I am Joshua Winder, a senior-level journalist and editor at World Stock Market. I specialize in covering news related to the stock market and economic trends. With more than 8 years of experience in this field, I have become an expert in financial reporting.


