
- GBP/USD was boosted by dollar weakness and risk appetite.
- Durable Goods Orders plummeted, and US companies felt the pain of tighter monetary policy.
- The EU and the UK have reached an agreement in Northern Ireland, which could boost the GBP.
The pair GBP/USD It is picking up some ground after hitting a daily low of 1.1921 as speculation mounts over the Brexit deal reached in Northern Ireland, which could boost the GBP in the near term. In addition, worse than expected US economic data is a headwind for the dollar. At the time of writing, GBP/USD is trading at 1.2052, up 0.65% from its opening price.
The US dollar (USD) is weakening across the board following a dismal durable goods orders report. January Durable Goods Orders slumped below expectations at -4.5%, down from last month’s revised 5.1%, the lowest reading since April 2020. So-called core orders excluding transportation , rose 0.7%, above December’s -0.4% decline.
The Dollar Index (DXY), which measures the value of the dollar against a basket of currencies, fell 0.62% to 104,594, reversing last Friday’s gains, thanks to an increase in the Federal Reserve’s (FED) preferred indicator for measure inflation, core PCE. Following the goods orders data, the DXY is down from around 105,100 right now.
Meanwhile, the latest headlines that the United Kingdom (UK) and the Eurozone (EU) have reached an agreement in Northern Ireland favored a rise in GBP/USD, as seen on the 1 hour chart. After oscillating around the daily pivot of 1.1970, GBP/USD jumped around 80 points, though reaching a daily high of 1.2054.
Sources on both sides told the BBC that the UK and the EU had reached a post-Brexit trade deal for Northern Ireland. Later, EU President Ursula von der Leyen and UK Prime Minister Rishi Sunak are expected to hold a press conference at around 15:30 GMT. Details of the agreement will be published later.
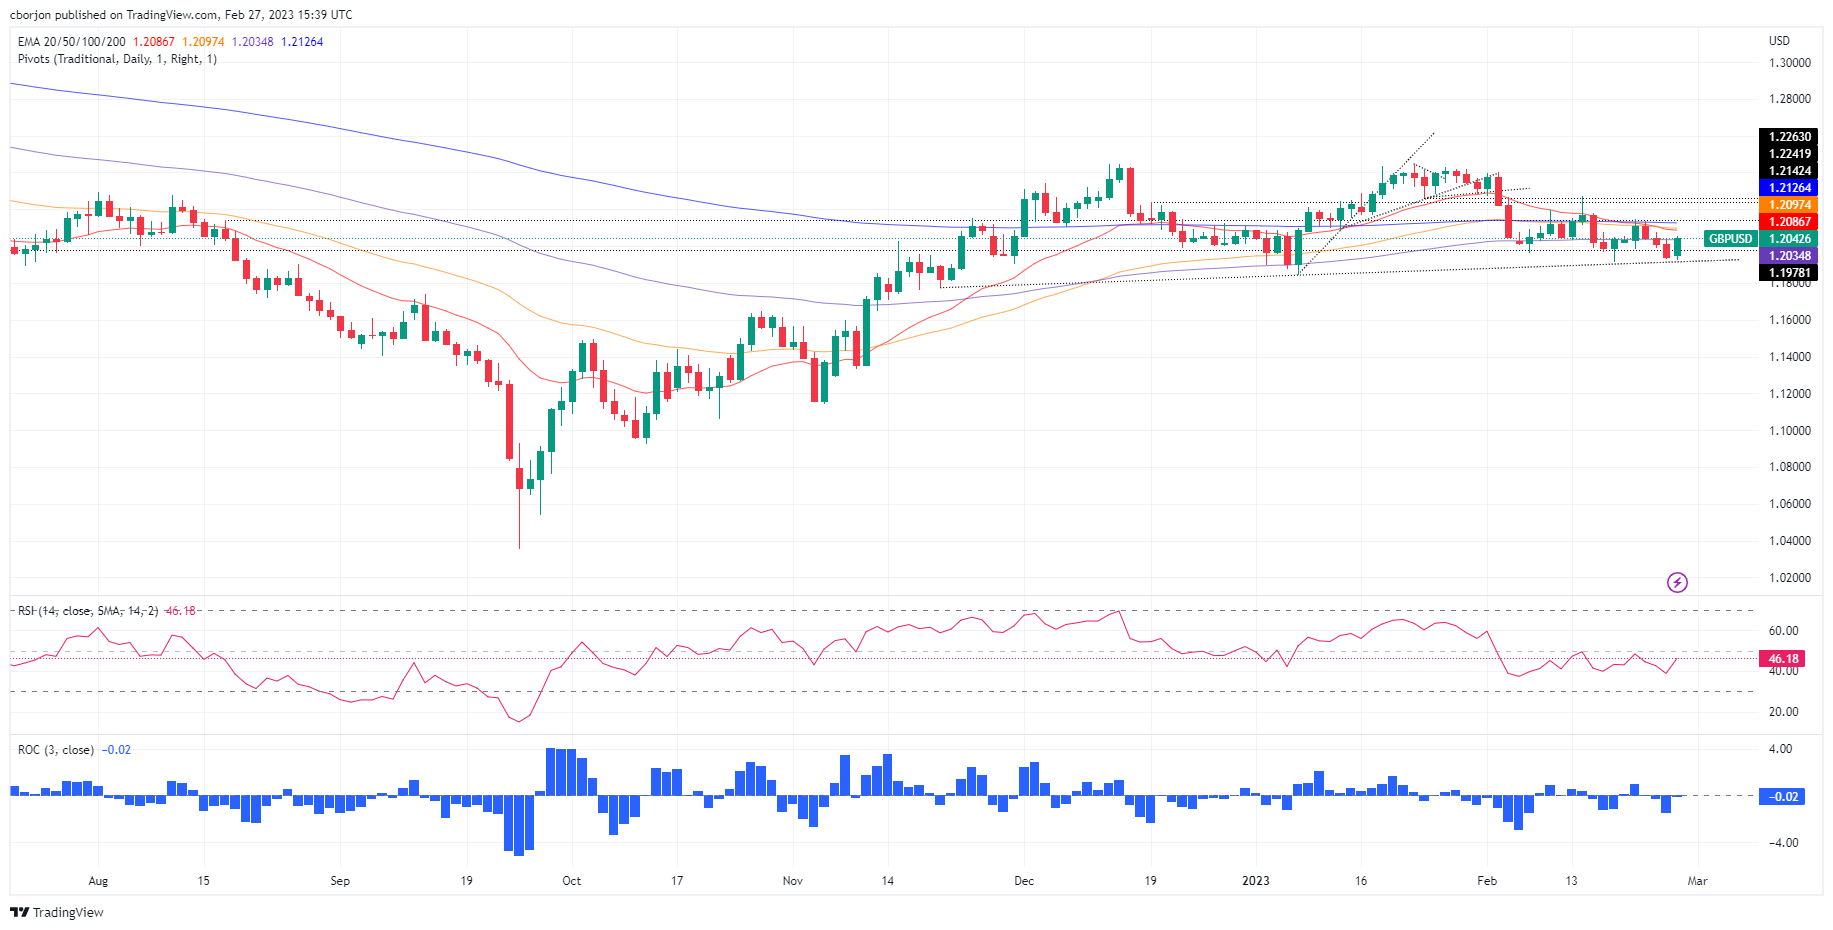
GBP/USD Technical Analysis
From a daily chart perspective, GBP/USD formed a bullish engulfing candle, which could send the pair rallying towards the 20-day EMA at 1.2088 before testing the 50-day EMA at 1.2097, far from the signal. of 1.2100. A break of the latter would expose the important 200 day EMA at 1.2126. As an alternate scenario, GBP/USD could fall towards last week’s low of 1.1927 before testing 1.1900.
Source: Fx Street
I am Joshua Winder, a senior-level journalist and editor at World Stock Market. I specialize in covering news related to the stock market and economic trends. With more than 8 years of experience in this field, I have become an expert in financial reporting.


