- GBP/USD is set to end the week down almost 1%.
- Risk markets mood and US jobs report weigh on GBP/USD.
- GBP/USD Price Forecast: A daily close below 1.2500 would open the door for further losses.
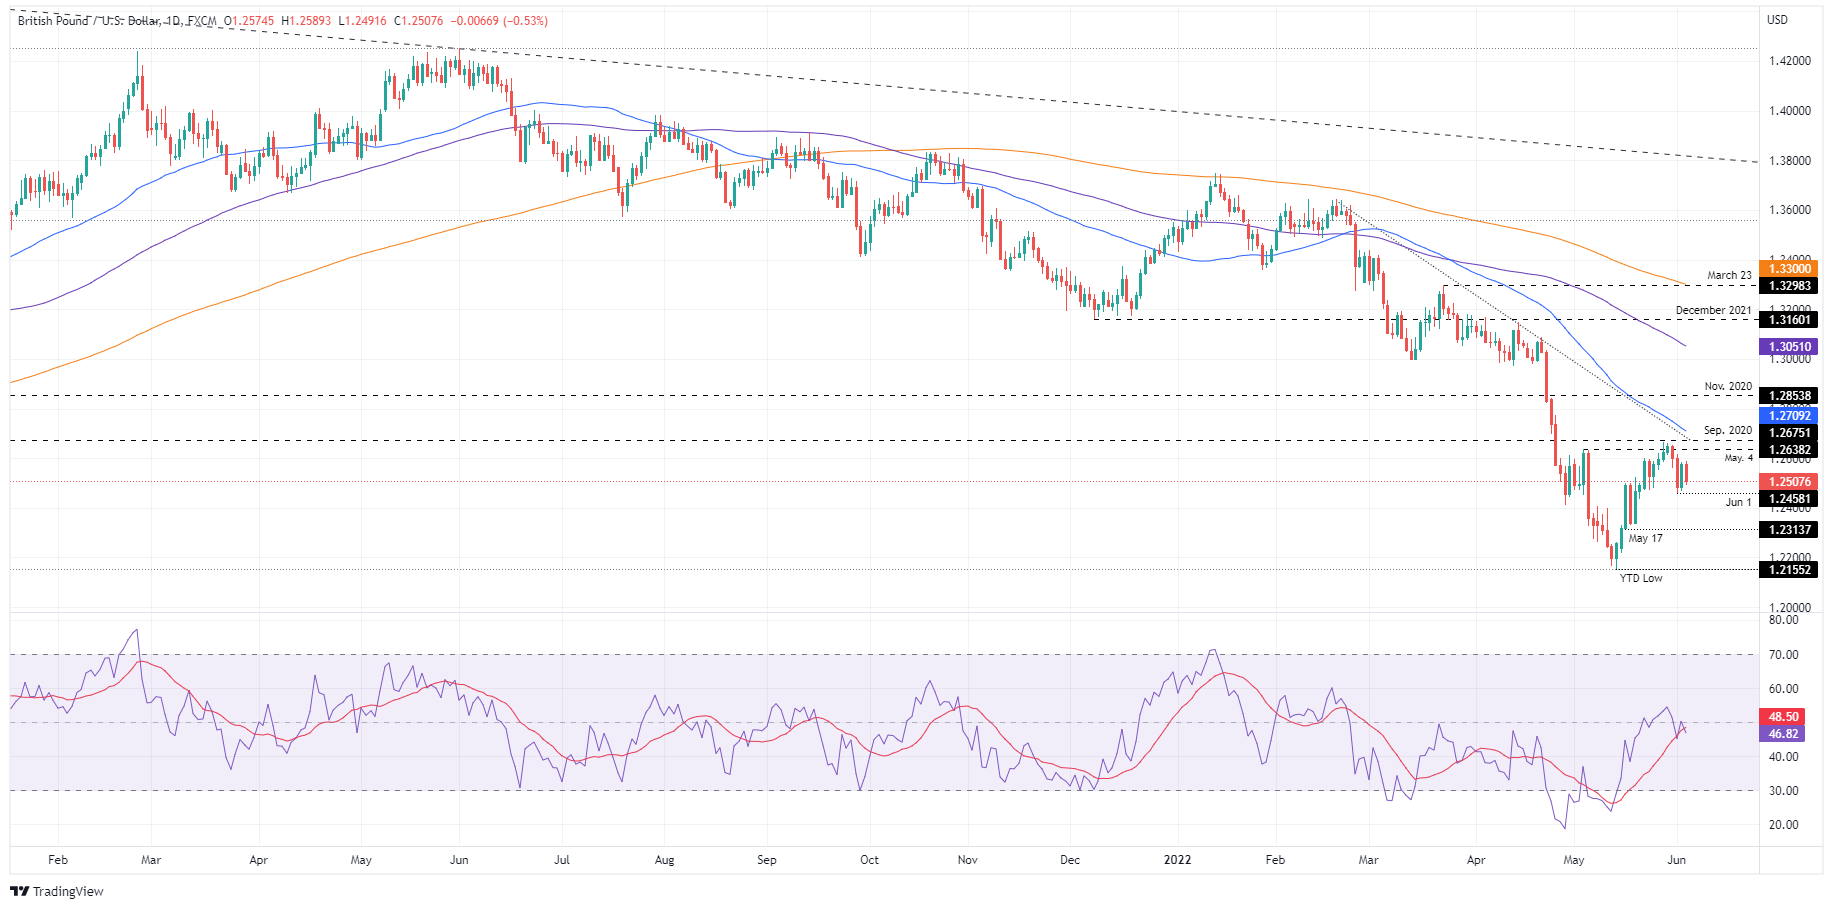
The GBP/USD flounders at 1.2600 and drops sharply below the 1.2500 figure after positive US economic data boosted the USD, while UK traders are still on holiday observing the Queen’s Jubilee. At 1.2507, the GBP/USD registers losses of 0.53% in the American session.
Risk aversion and strong US NFPs boost the dollar
Risk aversion in the market keeps market players on edge. Although the US non-farm payrolls report for May added 390,000 employees to the economy, better than the 318,000 expected, concerns that the US slips into a recession courtesy of the Federal Reserve’s pace of tightening are present. .
In the same report, median hourly earnings stood at 5.2% a year, still reflecting tightness in the labor market but allaying fears of a wage price spiral.
Analysts at TD Securities wrote in a note that “May’s report supports the view that while the labor market remains firm, it continues to gradually slow. We believe today’s report does not change the Fed’s estimate, supporting its inclination to bring forward interest rate hikes until reaching a more neutral stance in the autumn”.
Later, the Institute for Supply Management (ISM) revealed that the non-manufacturing PMI increased by 55.9, below the 56.4 expected. The report reflects business resilience, after first-quarter GDP shrank 1.5% last week, according to the second estimate from the Bureau of Economic Analysis.
In the coming week, the UK economic docket will include May BRC Retail Sales, Halifax House Price Index, and GDP month-on-month and the three-month average.
On the other hand, the members of the Federal Reserve Board begin their period of inactivity to prepare for the June meeting. However, investors’ eyes will be on the inflation report along with June UoM consumer sentiment.
GBP/USD Price Forecast: Technical Outlook
GBP/USD continues to have a bearish bias, as reflected on the daily chart. The daily moving averages (DMA) above the exchange rate, coupled with the RSI readings turning bearish and sloping downwards, opens the door for further losses. However, if GBP/USD is about to fall further, a break below the June 1 low at 1.2458 is required. Once broken, GBP/USD’s next support would be the May 17 daily low at 1.2313, followed by the year’s low at 1.2155.

Technical levels
GBP/USD
| Panorama | |
|---|---|
| Last Price Today | 1.2501 |
| Today’s Daily Change | -0.0078 |
| Today’s Daily Change % | -0.62 |
| Today’s Daily Opening | 1.2579 |
| Trends | |
|---|---|
| 20 Daily SMA | 1.2453 |
| 50 Daily SMA | 1.2725 |
| 100 Daily SMA | 1.3066 |
| 200 Daily SMA | 1,331 |
| levels | |
|---|---|
| Previous Daily High | 1.2586 |
| Previous Daily Minimum | 1.2469 |
| Previous Maximum Weekly | 1.2667 |
| Previous Weekly Minimum | 1.2472 |
| Monthly Prior Maximum | 1.2667 |
| Previous Monthly Minimum | 1.2155 |
| Daily Fibonacci 38.2% | 1.2542 |
| Daily Fibonacci 61.8% | 1.2514 |
| Daily Pivot Point S1 | 1.2503 |
| Daily Pivot Point S2 | 1.2428 |
| Daily Pivot Point S3 | 1.2386 |
| Daily Pivot Point R1 | 1.2621 |
| Daily Pivot Point R2 | 1.2662 |
| Daily Pivot Point R3 | 1.2738 |
Source: Fx Street
With 6 years of experience, I bring to the table captivating and informative writing in the world news category. My expertise covers a range of industries, including tourism, technology, forex and stocks. From brief social media posts to in-depth articles, I am dedicated to creating compelling content for various platforms.


