- The US dollar gets mixed results on Tuesday.
- Stocks rise sharply on Wall Street.
- GBP/USD maintains a very short-term positive bias, but limited while below 1.2300.
The pair GBP/USD rises for the second consecutive day, supported by the decline in the US dollar in general, amid risk appetite. The pair peaked at 1.2323 and then pulled back after being unable to hold above 1.2300.
The pound’s decline eventually found support at the 1.2250 area and then bounced higher, failing to recapture 1.2300. It is around 1.2270/80, up 30 points on the day.
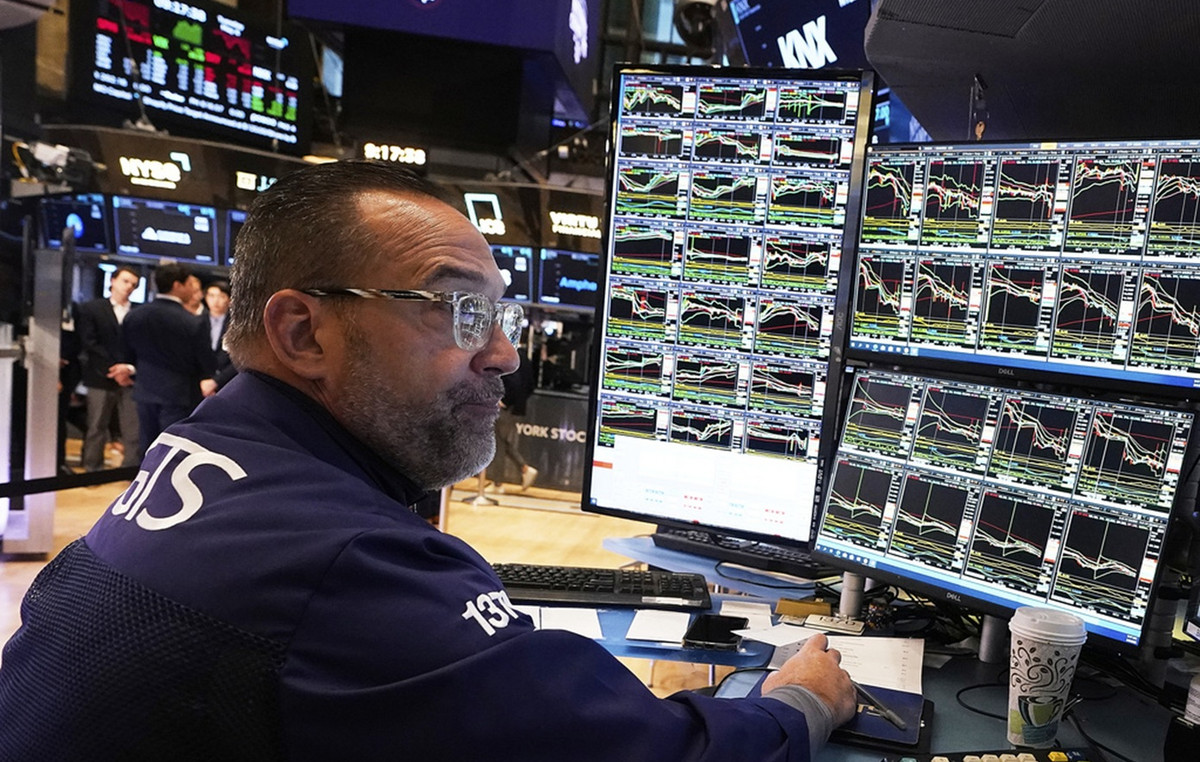
On Tuesday, the US dollar is mostly down while stocks are up. After the worst week in years, US indices are up strongly, with the S&P 500 up 2.52% and the Nasdaq gaining 3.15%. US yields are up slightly, with the 10-year yield at 3.28% and the 30-year yield at 3.35%.
US economic data released on Tuesday showed sales prices for existing homes hit a record high in May of $407,600. The annual rate of sales fell from 5.6 to 5.41 million. It was the fourth consecutive monthly decline. On Wednesday, Fed Chairman Powell will deliver semi-annual testimony to Congress.
In the UK, rail workers are on a 24-hour strike, the longest in more than 30 years. The union has rejected the companies’ latest offer. The Bank of England is expected to keep raising the key interest rate to curb inflation.
Huw Pill, chief economist at the BoE, said the central bank is willing to sacrifice growth to fight inflation. “Although it may seem like an obvious statement, the bank is doing a better job of addressing the trade-offs involved than it did earlier this year when it seemed reluctant to raise rates.” Pill added that the bank was prepared to act “more aggressively.” Notably, Saunders, Mann and Haskel dissented last week in favor of a move greater than 50 basis points. We suspect the 6-3 vote has already changed to at least 5-4 in favor of a 50bp hike at the next meeting,” BBH analysts explained.
Technical levels
GBP/USD
| Panorama | |
|---|---|
| Last Price Today | 1.2272 |
| Today’s Daily Change | 0.0020 |
| Today’s Daily Change % | 0.16 |
| Today’s Daily Opening | 1.2252 |
| Trends | |
|---|---|
| 20 Daily SMA | 1.2439 |
| 50 Daily SMA | 1.2545 |
| 100 Daily SMA | 1.2923 |
| 200 Daily SMA | 1.3222 |
| levels | |
|---|---|
| Previous Daily High | 1,228 |
| Previous Daily Minimum | 1.2199 |
| Previous Maximum Weekly | 1.2407 |
| Previous Weekly Minimum | 1.1934 |
| Monthly Prior Maximum | 1.2667 |
| Previous Monthly Minimum | 1.2155 |
| Daily Fibonacci 38.2% | 1.2249 |
| Daily Fibonacci 61.8% | 1,223 |
| Daily Pivot Point S1 | 1.2208 |
| Daily Pivot Point S2 | 1.2163 |
| Daily Pivot Point S3 | 1.2126 |
| Daily Pivot Point R1 | 1.2289 |
| Daily Pivot Point R2 | 1.2325 |
| Daily Pivot Point R3 | 1,237 |
Source: Fx Street
With 6 years of experience, I bring to the table captivating and informative writing in the world news category. My expertise covers a range of industries, including tourism, technology, forex and stocks. From brief social media posts to in-depth articles, I am dedicated to creating compelling content for various platforms.


