
- The GBP/USD pair is suffering from continued selling pressure and falls below 1.2600.
- The pound sterling records new weekly lows.
- Mixed US data supports the Dollar on Tuesday, while market sentiment changes.
The GBP/USD pair was virtually flat on Tuesday, before falling below the 1.2600 area during the American session, hitting one-week lows and losing a third of a percentage point on Tuesday.
Broader markets are seeing a favorable bid for the US Dollar (USD), with the Dollar rising against most major currencies on Tuesday.
Data releases from the United States were mixed, complicating market flows but keeping the dollar bid during the US trading session.
The Institute of Supply Management’s (ISM) Services Purchasing Managers’ Index (PMI) for November showed a slight uptick in the outlook, with a reading of 52.7 compared to the forecast of 52, and beating the reading of the previous month of 51.8.
Mixed data in the US, markets maintain their bid for the Dollar
In October, the JOLTS index of US job openings fell to its lowest level in two and a half years, 8.733 million, from 9.35 million the previous month (revised downward from 9.553 million ). The US labor market remains tight, despite the rapid cycle of rate hikes, and job shortages remain hard to find, weighing on investors’ expectations of Federal Reserve (Fed) rate cuts in the coming years. coming quarters.
The dollar will be the main driver in the middle of the week, as on Wednesday the latest ADP employment change report for November will be released, which is expected to show a rebound from the previous month, from 113,000 to 130,000 positions.
The Bank of England (BOE) will also report its latest financial stability report early on Wednesday, giving investors an idea of the extent to which the Bank of England is leaning towards a hawkish or dovish stance.
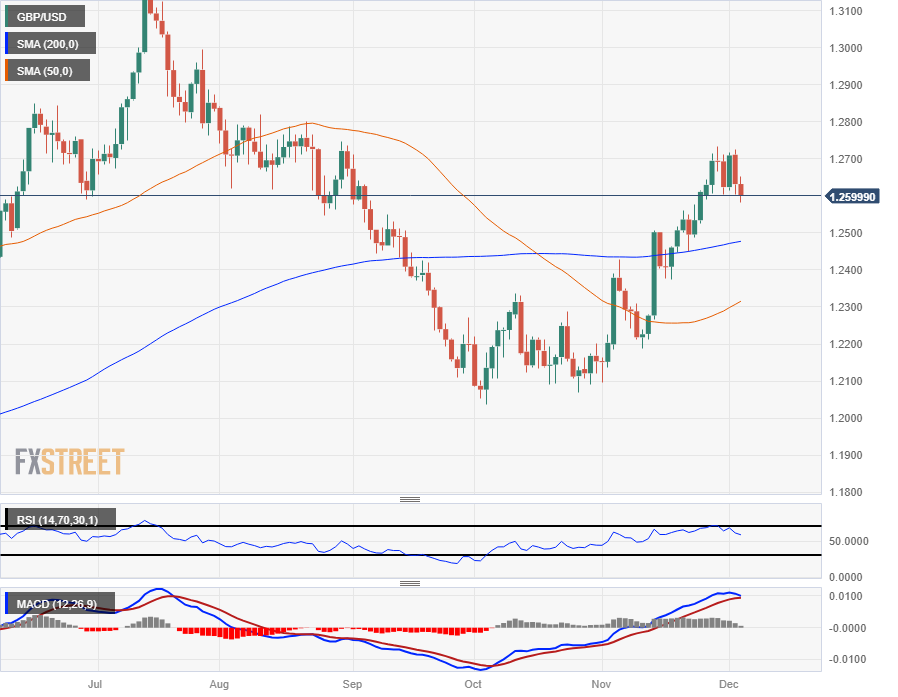
GBP/USD Technical Outlook
GBP/USD’s decline below 1.2600 sees the pair break out of its recent consolidation and prepare for a further decline towards the 200-day SMA below 1.2500.
The near-term limit of bullish momentum remains the upper limit of the recent consolidation near 1.2700, and bearish pullbacks will meet a bullish 50-day SMA currently rising from 1.2300.
GBP/USD is up almost six percent from October lows near 1.2040, but bullish momentum could be coming to an end as the pair sees a prolonged struggle to mark fresh gains on the chart.
GBP/USD Daily Chart
GBP/USD Technical Levels
Source: Fx Street
I am Joshua Winder, a senior-level journalist and editor at World Stock Market. I specialize in covering news related to the stock market and economic trends. With more than 8 years of experience in this field, I have become an expert in financial reporting.


