
- Inflation in the US stands at 3.1% year-on-year, with core CPI at 3.9%, suggesting long-lasting inflation that weighs on rate cut prospects.
- Rising US Treasury yields and strengthening US Dollar Index reflect markets' reassessment of the Fed's rate strategies.
- CME's FedWatch tool shows declining expectations for a Fed rate cut in May.
The pair GBP/USD falls below 1.2600 as strong economic data from the United States (US) suggests the Federal Reserve (Fed) would keep interest rates higher for longer. At the time of writing, the pair is trading at 1.2598 after reaching a daily high of 1.2683.
GBP/USD drops after US CPI data, traders await UK inflation figures
The US Bureau of Labor Statistics (BLS) indicated that inflation in January slightly exceeded forecasts, surprising traders. The Consumer Price Index (CPI) for January stood at 3.1% year-on-year, above the 2.9% forecast, although below the December figures. The core CPI, which excludes the volatility of food and energy prices, remained stable at 3.9%, exceeding the expected decline of 3.7% annually.
Following this data, US Treasury yields rose, dragging the Dollar Index (DXY) to a three-month high of 104.87, just shy of 105.00. Expectations of a first rate cut by the Federal Reserve were delayed until June, as CME's FedWatch tool showed, as the odds for May fell from 52.2% a day ago to 36.4%.
Meanwhile, UK employment data showed wage growth slowed again, while vacancies fell for the 19th consecutive report, falling by 26,000 from the August to October period. Investors will be keeping an eye on UK inflation data due on Wednesday, with the CPI and headline index expected to rise from 4% to 4.2% and from 5.1% to 5.2%.
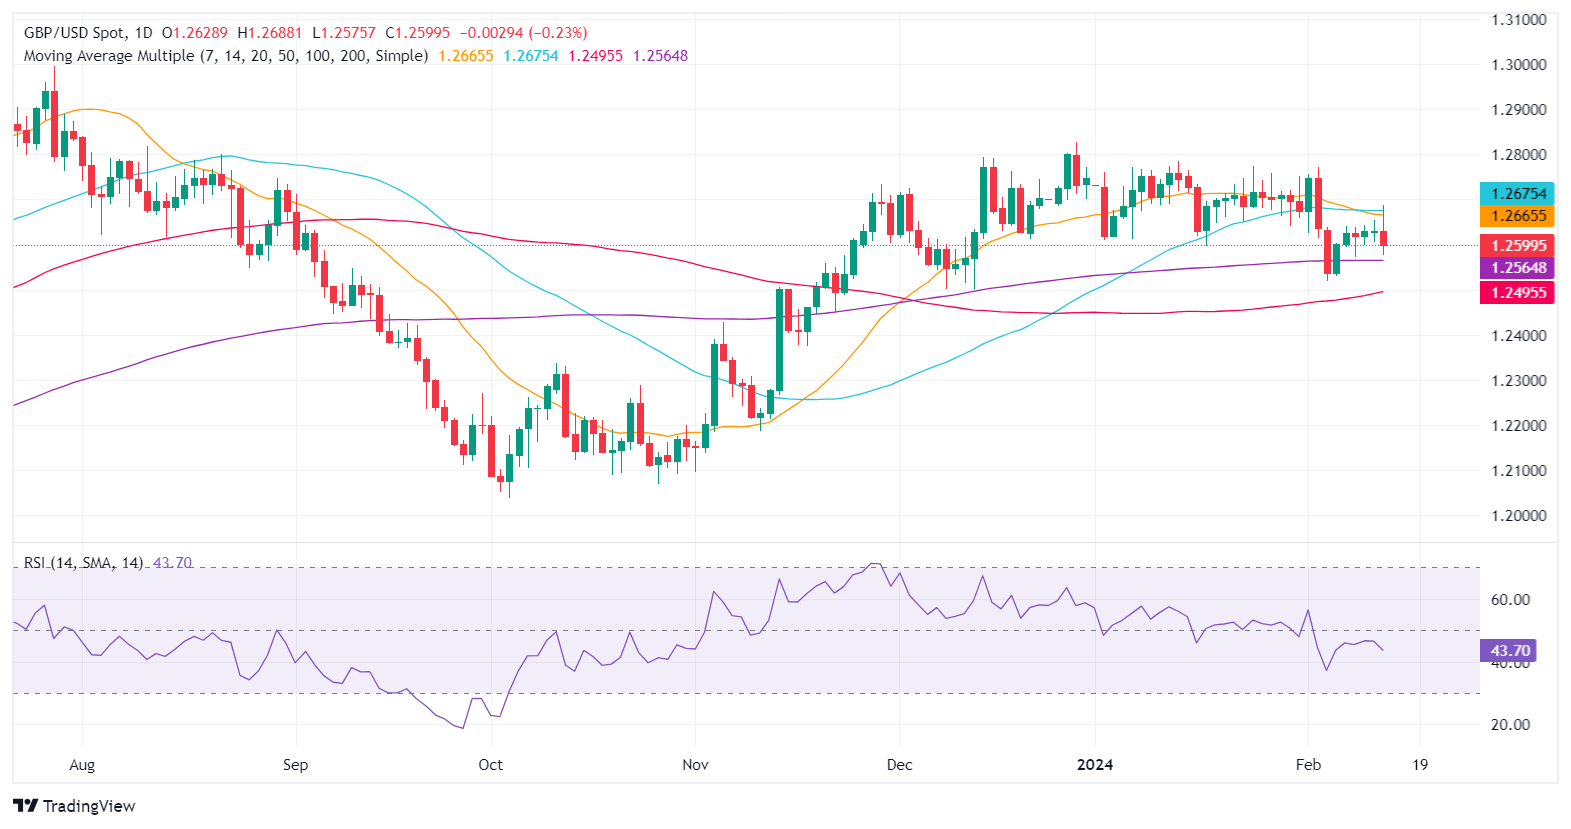
GBP/USD Price Analysis: Technical Outlook
The pair fell to a three-day low of 1.2575 before resuming higher, but the bias remains neutral. Although GBP/USD remains above the 200-day moving average (DMA), a daily close below 1.2600 could open the door to testing the latter around 1.2562, which could open the door to challenging the figure of 1.2500. A break below would expose the 100-DMA at 1.2484. On the other hand, if buyers reclaim the 50-DMA at 1.2671, this could pave the way to challenge 1.2700.
Source: Fx Street
I am Joshua Winder, a senior-level journalist and editor at World Stock Market. I specialize in covering news related to the stock market and economic trends. With more than 8 years of experience in this field, I have become an expert in financial reporting.


