
- GBP/USD stands at 1.2705, reflecting a slight decline of 0.02%, amid the publication of the FOMC Minutes.
- The FOMC minutes revealed that some Fed officials advocated a 25 basis point rate hike, citing tight labor markets as the main reason.
- The Federal Reserve staff forecast a mild recession towards the end of the year.
- Market expectations for two rate hikes were unchanged, with odds for November at 31%, while for July, odds stand at 88.7%, according to CME’s FedWatch tool.
He GBP/USD round 1.2700, as the latest Federal Reserve Open Market Committee (FOMC) minutes showed that some Fed officials wanted to raise rates. Still, they agreed to pause to assess the impact of the Fed’s cumulative tightening amid its tight stance. GBP/USD is trading at 1.2692, down 0.12%.
The US Dollar Index (DXY) barely reacted to the data, holding firm around 103.290, while US Treasury yields continued to rise after the June minutes were released. Expectations for two rate hikes were unchanged, with odds for November standing at 31%, while for July, odds for a rate hike stand at 88.7%, CME’s FedWatch tool shows.
Summary of the June FOMC Meeting Minutes
The FOMC Minutes showed that all participants deemed it appropriate or acceptable to leave rates unchanged to assess the impact of cumulative tightening. However, Fed officials who wanted to raise rates by 25 basis points cited a tight labor market as the main reason for a hike. At the same time, all participants agreed to maintain a restrictive stance as appropriate.
Meanwhile, Fed staff see a mild recession later in the year, as mentioned in the May minutes, while upside risks to the inflation outlook, or the possibility of inflation expectations de-anchoring, remain. being key to political prospects.
GBP/USD Price Analysis: Technical Perspective
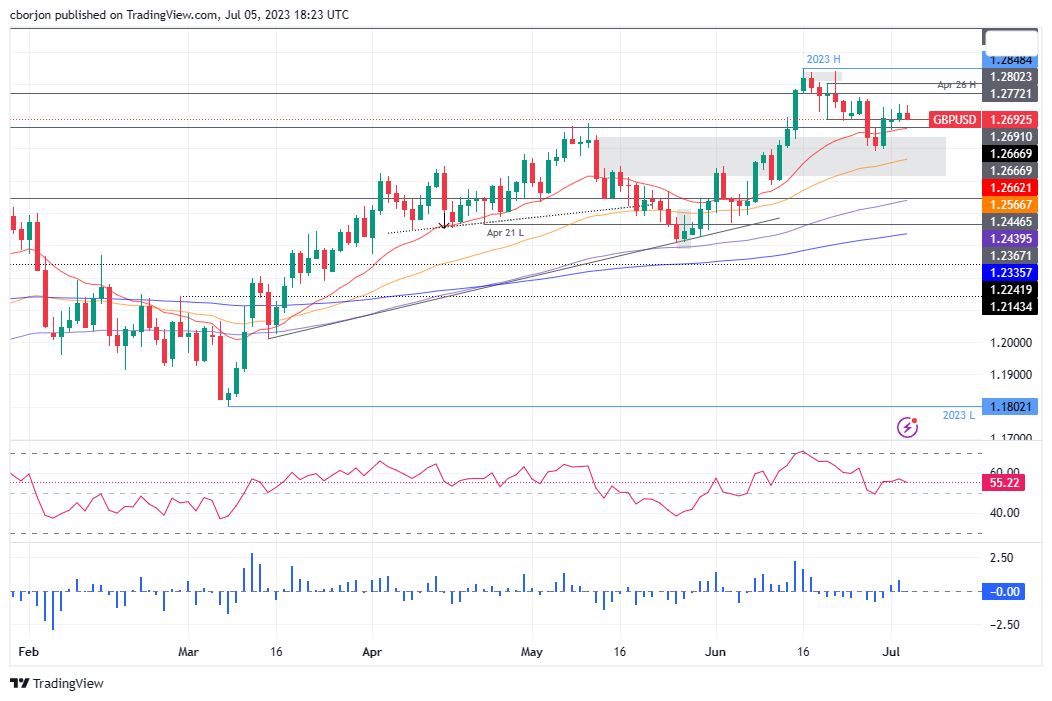
GBP/USD did not react to the data, although it turned lower, but remained above the 1.2700 mark. However, GBP/USD remains capped by the 1.2739 weekly high seen last Tuesday, but failed to dip below the 1.2700 figure. From the oscillators perspective, the Relative Strength Index (RSI) falls towards the midline of 50, while the Three-Day Rate of Change (RoC) shows buyers losing momentum. But unless GBP/USD falls below 1.2700, upside risks remain. To the downside, key support levels lie at the 20-day EMA at 1.2662, followed by the 1.2600 figure and the 50-day EMA at 1.2567. On the upside, resistance is at 1.2700, followed by 1.2736 and 1.2750.
Source: Fx Street
I am Joshua Winder, a senior-level journalist and editor at World Stock Market. I specialize in covering news related to the stock market and economic trends. With more than 8 years of experience in this field, I have become an expert in financial reporting.


