
- The feeling of the consumer of the University of Michigan collapses to 50.8, the lowest level since July 2022; Inflation expectations increase dramatically.
- Mixed US housing data, import prices increase unexpectedly; Powell and Jefferson warn of premature relief.
- The United Kingdom’s data vacuum leaves the drift sterling; Operators expect the key inflation data of the United Kingdom, preliminary PMIs and retail sales next week.
The sterling pound goes back to the US dollar during the US session, ready to close the week with minimum losses of more than 0.24%. The absence of an economic agenda in the United Kingdom on Friday left the operators drift from US data, which revealed that consumers are becoming pessimistic about the economy. The GBP/USD is quoted at 1,3276, with a 0.39% drop
The GBP/USD fluctuates and is ready to close the week in negative, despite the discouraging US consumer data.
Recently, Michigan University revealed that the May consumer’s feeling index fell to its lowest level since July 2022, in 50.8, below the forecasts of an improvement to 53.8, going down from April 52.2. The survey also showed that inflation expectations for next year increased from 6.5% to 7.3% and for the next five years they jumped from 4.4% to 4.6%.
Other US data showed that import prices unexpectedly increased in April, due to an increase in the cost of capital goods and a weaker US dollar. The US housing data were mixed, with the beginning of construction increasing in April, while construction permits fell to a minimum of almost two years.
The GBP/USD took to react to US data but slid below 1.33. On Thursday, the president of the Fed, Jerome Powell, revealed that “certain aspects of the Fed approach are permanent, such as the focus on inflation expectations.”
Until now, US economic data published during the week have shown an evolution in the disinflation process. However, Fed officials were reluctant to relieve policy, since they remain uncertain on US commercial policies, tariffs and their effects on inflation. The governor of the Fed, Jefferson, emphasized that an inflation reactivation could be temporary or persistent.
In the front of growth, retail sales continued to decelerate themselves in April. However, the last update of the Atlanta Fed suggests that the US economy could grow at a rate of 2.4%, lowering 2.5% a day ago, the Atlanta Fed revealed.
Next week, the United Kingdom’s economic agenda will include the meeting between the United Kingdom and the European Union along with the publication of the United Kingdom inflation figures, preliminary PMIs and retail sales. In the US, attention will be paid to a series of speakers of the FED, the preliminary PMIs and housing data.
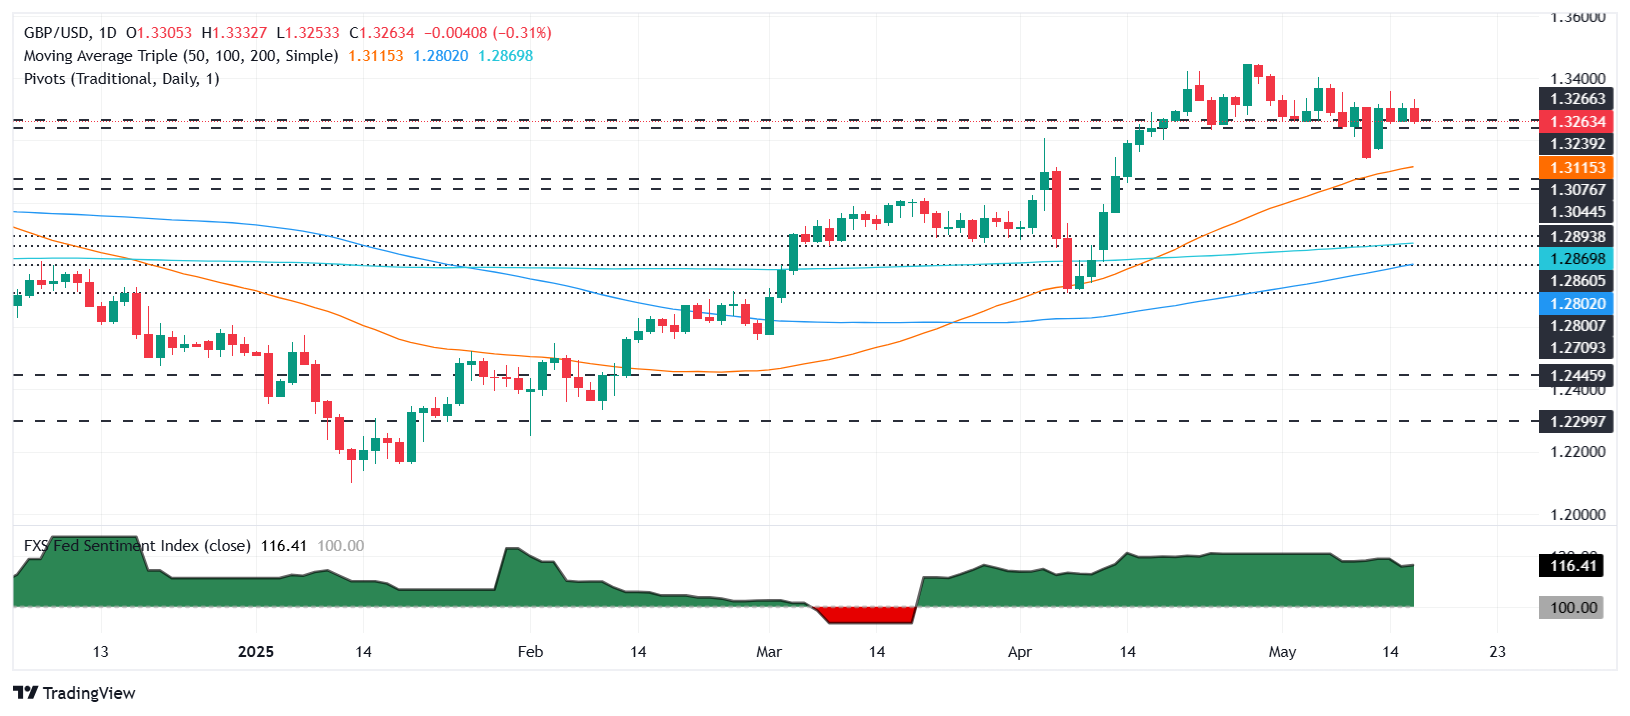
GBP/USD price graph: Technical perspective
The GBP/USD has fallen below 1.33, and could close the week below this level. This could pave the way for a setback, although sellers must exceed the minimum daily of May 15, 1,3248, to be able to challenge the simple mobile average (SMA) of 50 days in 1,3112. In case of greater weakness, the following support would be the level of 1.3000.
On the contrary, if the GBP/USD closes above 1.33, buyers could try 1,3350. A clear rupture of that level could expose the peak of the year to date (YTD) in 1,3443.
LIBRA ESTERLINA PRICE THIS WEEK
The lower table shows the percentage of sterling pound (GBP) compared to the main currencies this week. Libra sterling was the strongest currency against the New Zealand dollar.
| USD | EUR | GBP | JPY | CAD | Aud | NZD | CHF | |
|---|---|---|---|---|---|---|---|---|
| USD | 0.89% | 0.34% | -0.19% | 0.63% | 0.35% | 0.90% | 0.58% | |
| EUR | -0.89% | -0.41% | -0.50% | 0.24% | 0.10% | 0.49% | 0.17% | |
| GBP | -0.34% | 0.41% | 0.08% | 0.65% | 0.52% | 0.84% | 0.59% | |
| JPY | 0.19% | 0.50% | -0.08% | 0.82% | -0.09% | 0.23% | 0.54% | |
| CAD | -0.63% | -0.24% | -0.65% | -0.82% | -0.02% | 0.26% | -0.07% | |
| Aud | -0.35% | -0.10% | -0.52% | 0.09% | 0.02% | 0.29% | 0.05% | |
| NZD | -0.90% | -0.49% | -0.84% | -0.23% | -0.26% | -0.29% | -0.35% | |
| CHF | -0.58% | -0.17% | -0.59% | -0.54% | 0.07% | -0.05% | 0.35% |
The heat map shows the percentage changes of the main currencies. The base currency is selected from the left column, while the contribution currency is selected in the upper row. For example, if you choose the sterling pound from the left column and move along the horizontal line to the US dollar, the percentage change shown in the box will represent the GBP (base)/USD (quotation).
Source: Fx Street
I am Joshua Winder, a senior-level journalist and editor at World Stock Market. I specialize in covering news related to the stock market and economic trends. With more than 8 years of experience in this field, I have become an expert in financial reporting.


