
- GBP trades tight: It remains below the 50 day EMA, trading at 1.2724, with important UK GDP data on Friday.
- Bank of England Stance: Market odds suggest a September rate hike of 85%, which could put the bank rate at 5.75% in December.
- Pending the US CPI figures for July, expectations are at 0.2% m/m; annual inflation is estimated at 4.8%, which will guide future Fed decisions.
The GBP/USD pair falls modestly during the North American session, below the 50 day EMA, although the US Dollar (USD) remains weak overall, as speculators prepare for the release of the inflation data in the United States (USA). GBP/USD is trading at 1.2724, down 0.18%.
GBP/USD trend uncertain as markets digest US and UK growth and inflation data
The British Pound (GBP) continues to trade in a tight range amid a lack of catalyst during the early part of the week as the UK Economic Agenda will release its first part of market-moving data on Friday, with Gross Domestic Product (GDP) for the second quarter at its preliminary reading expected to slow to 0%, down from the previous quarter’s 0.1% growth, on quarterly data. On a yearly basis, second quarter GDP is estimated to remain unchanged at 0.2%, while June’s month-on-month data will improve on the May contraction. If the UK economy continues to show weakness, GBP/USD could accelerate its downtrend as the data could prevent the Bank of England (BoE) from aggressively tightening monetary policy.
In this sense, the odds of the Bank of England rising by a quarter of a percentage point in September stand at 85% in money market futures, while December has already been priced in, suggesting that the rate banking would reach a maximum of 5.75%, compared to 6.5% at the beginning of August.
Across the pond, the US Department of Labor will release the July inflation report, which is expected to show that the deflationary process in the US economy is still on track, but not as fast as labor officials had hoped. Fed. The monthly and annual Consumer Price Index is expected to stand at 0.2% and 3%, respectively. The monthly data would remain unchanged from June, while the interannual rate would improve from 3.3%. Excluding volatile items, the so-called core CPI is expected to hold at 0.2%m/m, with estimated annual inflation of 4.8%, the same as in June.
US central bank officials had begun to split between dovish and hawkish positions. Still, GBP/USD traders should wait for tomorrow’s data, which could shed some light on the future path of the US Federal Reserve (Fed) on monetary policy.
CME’s FedWatch tool shows the odds for a September rate hike at 13.5% as money market futures do not expect borrowing costs to rise. However, if Fed officials start to stack into the dovish stance, any sign of a rate cut would weaken the dollar; hence further rises in GBP/USD are expected.
Against this background, GBP/USD could remain subdued awaiting US data. After that, a rally could weigh on GBP/USD, but UK GDP data could rock the boat and turn the pair higher. Therefore, GBP/USD traders should exercise caution.
GBP/USD Price Analysis: Technical Perspective
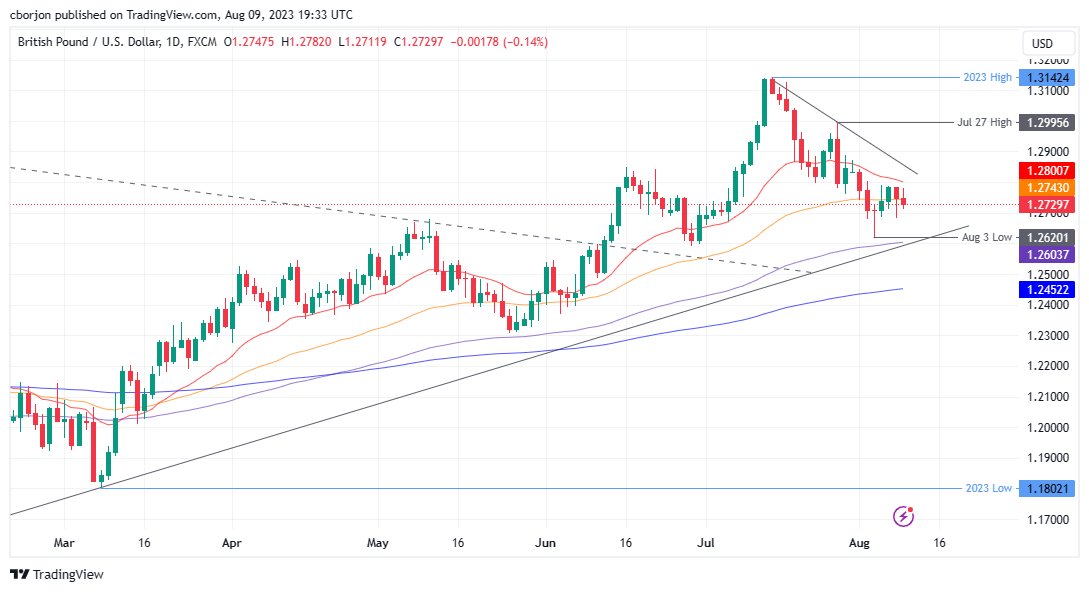
GBP/USD has a neutral to bearish bias as it has hit a successive series of lower highs and lower lows, but remains timid about taking a decisive direction awaiting fundamental news from the US and the US. United Kingdom. As GBP/USD dips below the 50 day EMA, the next support level to challenge is the current week’s low of 1.2684. A break of the latter would expose the August 3 low at 1.2620, followed by the 100 day EMA at 1.2603. On the other hand, if GBP/USD recaptures the 20-day EMA at 1.2800, it could pave the way to test a trend line of resistance to the downside around 1.2830/40.
Source: Fx Street
I am Joshua Winder, a senior-level journalist and editor at World Stock Market. I specialize in covering news related to the stock market and economic trends. With more than 8 years of experience in this field, I have become an expert in financial reporting.


