
- GBP/USD falls after strong US data bolsters the case for further Federal Reserve tightening and higher Treasury yields.
- Upward revision to US GDP and falling initial jobless claims paint a bright US economic picture, triggering GBP/USD slide.
- The UK’s empty economic calendar and the Bank of England Governor’s comments on possible rate hikes have traders watching USD dynamics.
The GBP/USD pair falls sharply in the North American session after the release of the most notable data from the United States (USA), which paint an optimistic economic picture and cement the case for further tightening by the US Federal Reserve (Fed). Therefore, the dollar is rising, supported by high US Treasury yields. At the time of writing, GBP/USD was trading at 1.2611, down 0.18%.
Supportive US data and forecast of further Fed tightening hold sterling back
The US dollar is the main mover for the session as the data continues to surprise market participants. The US Gross Domestic Product (GDP) was revised up to an advance of 2% year-on-year, above estimates of 1.3%. At the same time, a labor market measure, initial jobless claims, posted the biggest drop in 20 months, to 239,000, below estimates of 265,000, which could trigger another Fed hike to cool demand. .
Following the data release, GBP/USD fell from 1.2660 towards 1.2600, extending its decline to a fresh two-week low of 1.2590. The Dollar strengthened as did US Treasury yields, with the 40-year yielding 3.846%, gaining 14 basis points, reaching levels last seen in March 2023.
Meanwhile, Fed Chairman Jerome Powell crossed the wires, saying the labor market remains tight, inflation too high, and expressed the Fed’s “long way to go” before inflation returns to target 2% from the Fed. He added that the majority of the Federal Reserve’s Open Market Committee (FOMC) expects “two or more” interest rate hikes by the end of the year.
Other data showed that pending home sales fell in May to their lowest level in five months, at -22.2% yoy, worse than April’s -20% contraction.
Apart from this, an empty economic calendar in the UK left traders adrift on the dynamics of the US dollar, as well as the mood of the markets. However, the British Pound (GBP) weakened after comments by the Governor of the Bank of England (BoE), Andrew Baily, in which he stated that rates could continue to rise, which would hurt the British economy. Although it could boost GBP/USD, it would hurt the economy. That can be seen by GBP/USD falling after the BoE’s 50 basis point rate hike.
Money market futures see a 65% chance of a 50 basis point rise at the next BoE meeting. As for the Federal Reserve, CME’s FedWatch tool estimates a 25 basis point rise in July to 86.8%, up from 81.8% yesterday.
Upcoming events
The United Kingdom’s economic calendar will publish the Gross Domestic Product (GDP) for the first quarter of 2023, the current account and Business Investment. In the United States, the Bureau of Economic Analysis (BEA) will publish the Fed’s preferred inflation gauge, Core Personal Consumption Expenditure (PCE). The University of Michigan will also release Consumer Sentiment, while the Chicago Fed will release its PMI.
GBP/USD Price Analysis: Technical Insights
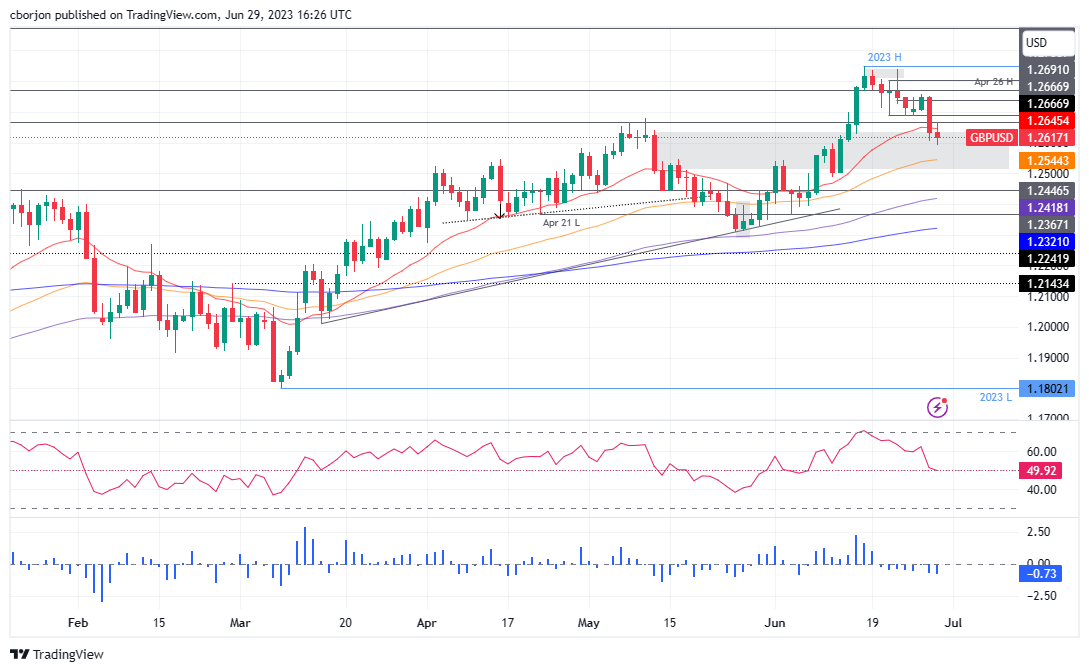
GBP/USD could extend its losses if it achieves a daily close below 1.2600; otherwise, GBP buyers could continue to wait for a possible test of the 20-day EMA at 1.2645. However, if the GBP/USD breaks above 1.2600, the next support would be the 50-day EMA at 1.2544 before 1.2500.
Source: Fx Street
I am Joshua Winder, a senior-level journalist and editor at World Stock Market. I specialize in covering news related to the stock market and economic trends. With more than 8 years of experience in this field, I have become an expert in financial reporting.


