
- The Pound is trading higher for the second day in a row.
- The agreement on the US debt ceiling favored a positive environment in the markets.
- The focus is on the US May NFP data.
The Pound is trading with gains near the 1.2350 zone and is benefiting from the positive market environment fueled by the announcement on Sunday of a debt ceiling deal between US President Joe Biden and the Republican Speaker of the House of Representatives Kevin McCarthy. Although neither of the two countries will publish relevant economic reports, the pace of the session will be dictated by the market’s assessment of the aforementioned agreement.
US stocks rise signaling a positive mood in the market
On Sunday, Joe Biden and Kevin McCarthy made a joint announcement claiming they had reached an agreement on extending the debt ceiling. Under the proposed deal, the government would be allowed to borrow money without raising the limit, which would be temporarily suspended until 2025. However, the proposal still requires congressional approval, though US officials are confident it will pass.
News of the deal was welcomed by Wall Street futures, sending their value up and putting downward pressure on the US dollar.
For the rest of the week, the focus will be on the US Non-Farm Payrolls (NFP) data for May, which is expected to hint at more pain in the US labor market. In this sense, the outlook may have an impact on the expectations of the next meeting of the Federal Reserve (Fed) in June and, therefore, on the price dynamics of the US dollar.
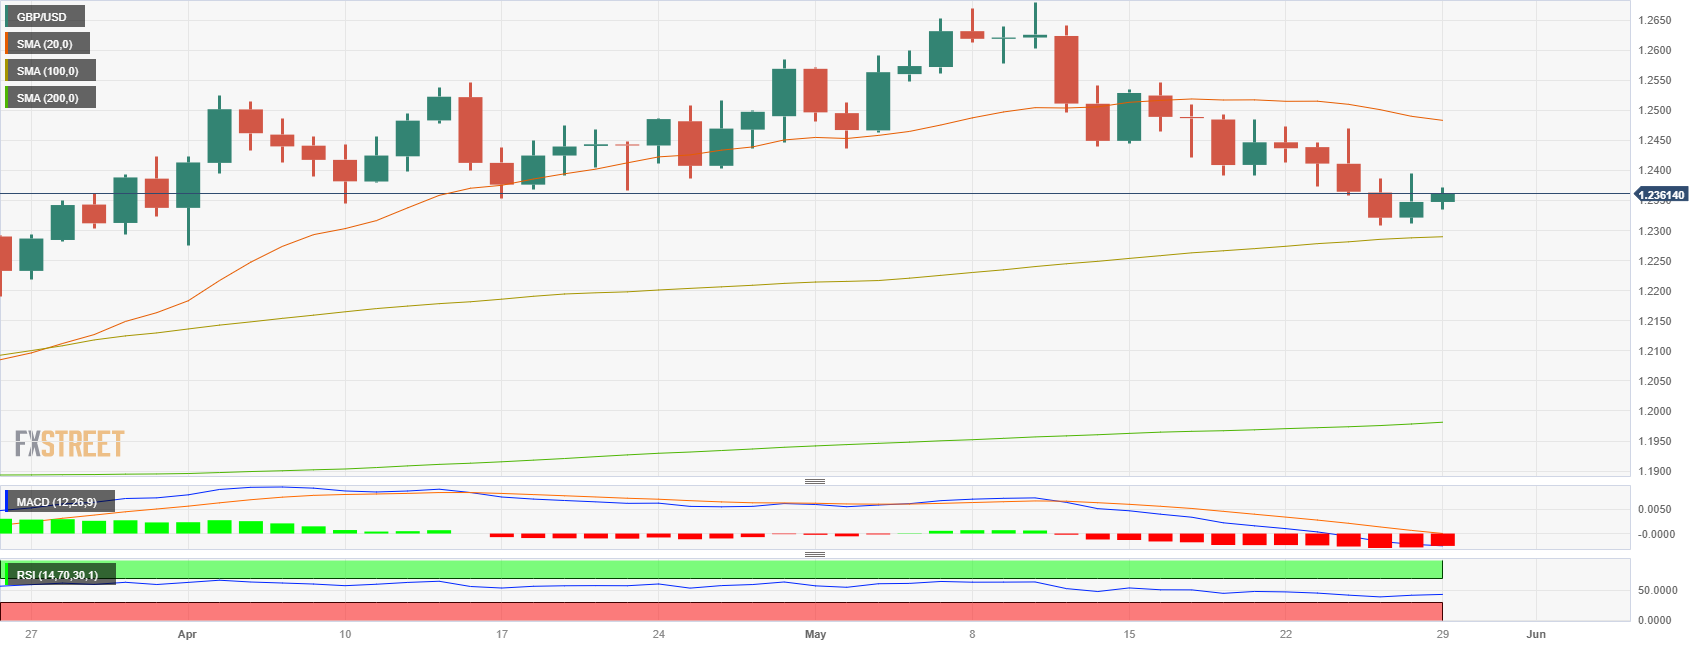
Levels to watch
From a technical point of view, GBP/USD maintains a neutral to bearish outlook in the short term. The bears are struggling to maintain their dominance, but technical indicators remain unfavorable, suggesting that the market may still have some downside potential.
The key psychological level of 1.2320 is the immediate support level for GBP/USD. A break below this level could pave the way towards the 100 day SMA at the 1.2290 area and then towards the 1.2250 area. Also, a move above the 1.2390 level would support bullish momentum with next resistances at the 1.2450 area and the 20-day SMA at 1.2480.
Source: Fx Street
I am Joshua Winder, a senior-level journalist and editor at World Stock Market. I specialize in covering news related to the stock market and economic trends. With more than 8 years of experience in this field, I have become an expert in financial reporting.


