
- GBP/USD will end the week down 0.16%.
- Weaker UK inflation data justifies the Bank of England taking further action, albeit on a lesser scale.
- The higher-than-expected US CPI and PPI numbers for January justify calls by Fed officials for a 50 basis point increase in upcoming meetings.
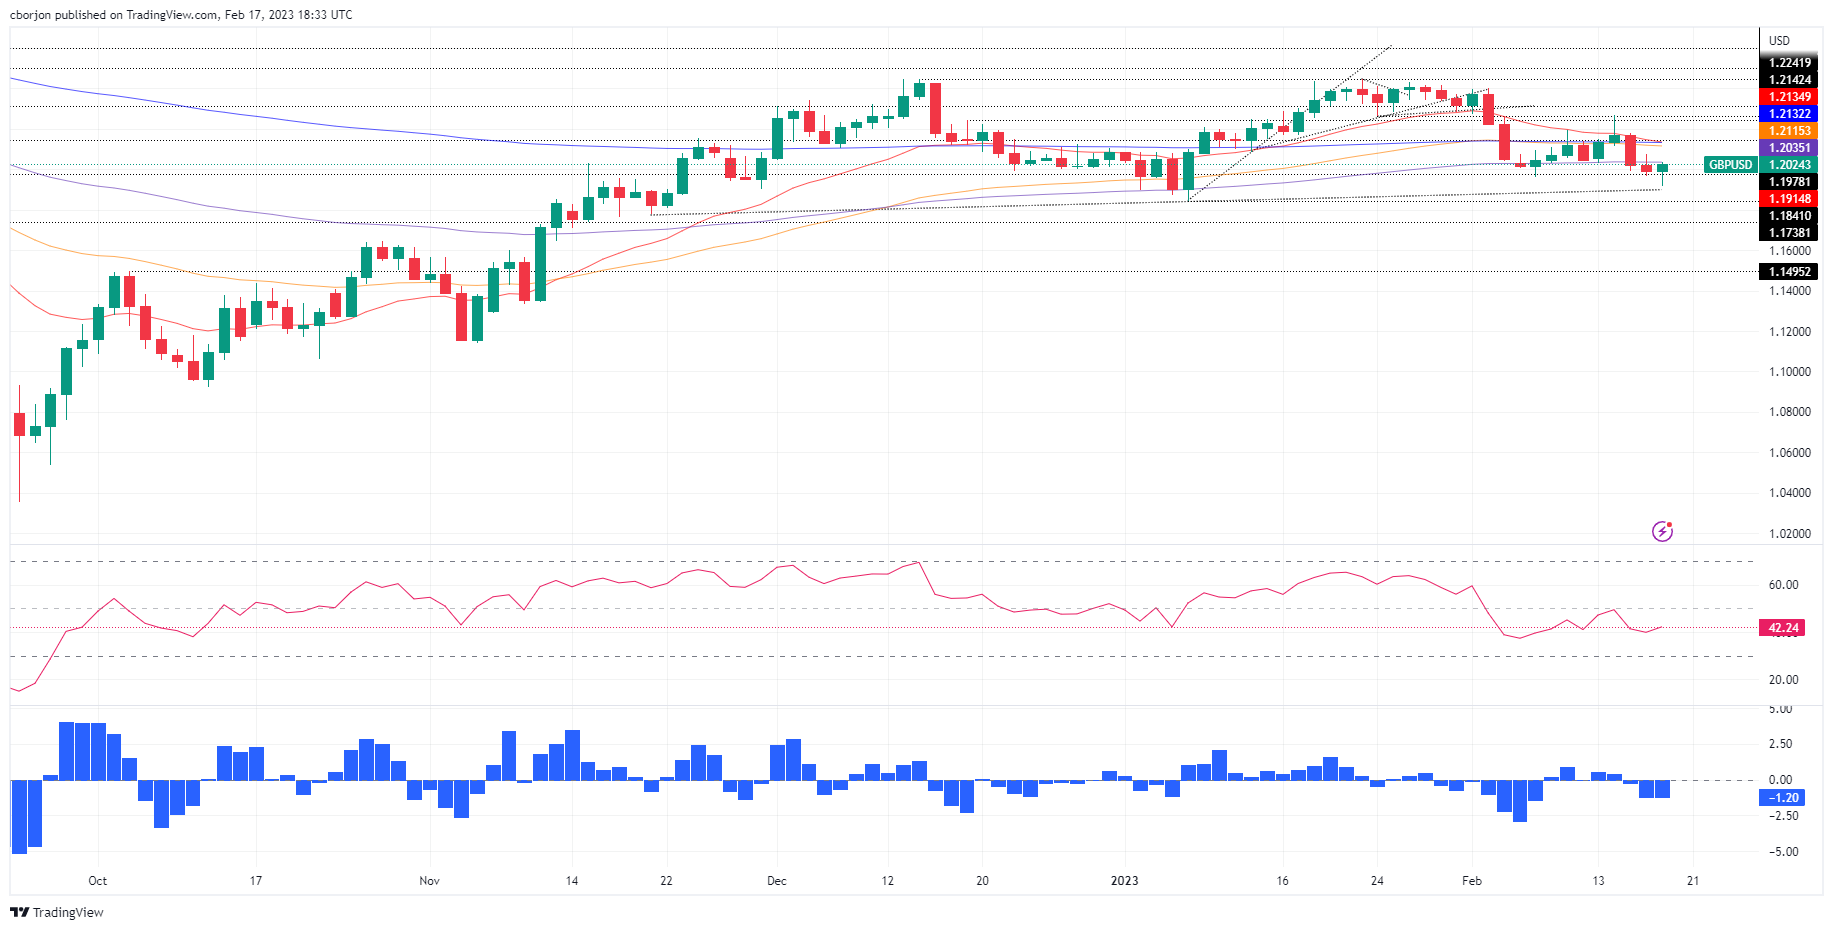
The pair GBP/USD It is recovering after falling to February lows around 1.1914 in the North American session, boosted by general US dollar weakness. However, it is still trading below the important 200-day EMA at 1.2132, keeping the downtrend intact. As of this writing, GBP/USD is trading above 1.2020, 0.30% above its opening price.
GBP/USD pressured by the expected aggressiveness of the Fed, against the BoE
Data from both sides of the Atlantic kept GBP/USD depressed, which eventually fell below the 200 day EMA. The UK inflation report released on Tuesday added to speculation that the Bank of England (BoE) would not raise rates as aggressively as expected. This, along with a softer-than-expected US Consumer Price Index (CPI) for January, which beat bank analysts’ estimates, raised the likelihood of further tightening by the Federal Reserve. US (Fed).
The latest piece of the puzzle that boosted US Treasury yields and the dollar was the Producer Price Index (PPI) for January, whose monthly data beat estimates. This prompted hard-line comments from two Federal Reserve (Fed) officials, who said rates need to stay higher for longer, expecting them to exceed the 5.0% threshold.
Another factor influencing investor reaction was the Philadelphia Fed’s manufacturing index, which plunged, but comments in the survey of business executives noted that input prices rose for the first time in 10 months. Against this backdrop, money market futures are pricing in a tougher Federal Reserve.
As a result, GBP/USD extended its losses on Thursday, falling 0.26%. But as the New York session progresses, the British pound (GBP) has gained traction against the US dollar (USD), setting the stage to challenge the 100 day EMA.
GBP/USD Technical Analysis
The daily chart of the GBP/USD pair shows the pair with a bearish bias, despite the fact that it is recovering after falling for two consecutive days. The major currencies found buyers around the 1.1900 area, triggering a rally to the daily high at 1.2037, the 100 day EMA, where GBP/USD was quickly rejected.
If GBP/USD achieves a daily close above the 100 day EMA, the pair will rally towards the confluence of the 200 and 20 day EMAs, each at 1.2132/35, respectively. On the other hand, a bearish resumption could follow once GBP/USD falls below 1.1914, followed by 1.1900.
Source: Fx Street
I am Joshua Winder, a senior-level journalist and editor at World Stock Market. I specialize in covering news related to the stock market and economic trends. With more than 8 years of experience in this field, I have become an expert in financial reporting.


