
- US nonfarm payrolls rose by 223,000, beating estimates, while the unemployment rate fell.
- Median Hourly Earnings were below the 5% forecast, a sign that wage inflation is subsiding.
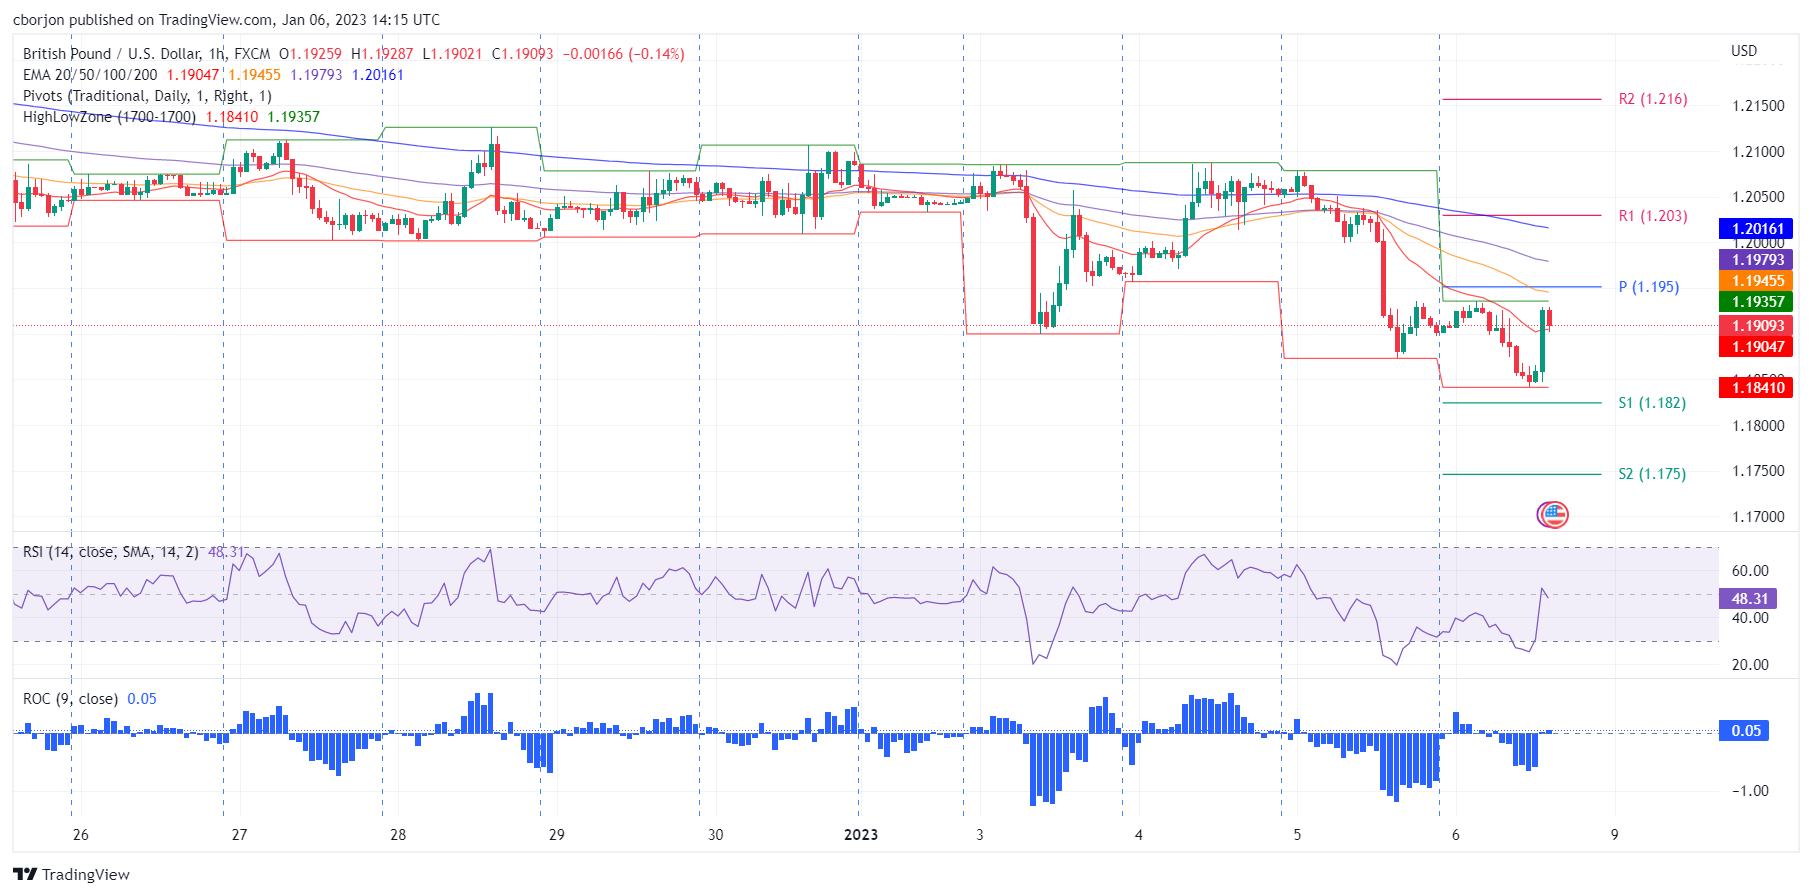
- GBP/USD Price Analysis: The rally could cap around the 50 EMA and the confluence of the daily pivot around 1.1950.
The GBP/USD is paring some of its losses on Thursday as the US Labor Department released upbeat economic data, which was positive, although the US dollar (USD) is weakening overall. Therefore, the pair GBP/USD It is trading with volatility around 1.1900-1.1920, after hitting a daily low of 1.1841.
Investor sentiment remains upbeat following the release of the US Bureau of Labor Statistics’ December Nonfarm Payrolls report. Payrolls increased by 223,000, beating estimates of 200,000, demonstrating the strength of the labor market and justifying the need for more Federal Reserve (Fed) tightening. The data showed the Unemployment Rate fell to 3.5%, while Median Hourly Earnings fell to 4.6% yoy, versus estimates of 5%.
According to a tweet from Nick Timiraos, a Fed watcher at the Wall Street Journal (WSJ), “revisions to the median hourly earnings data paint a marginally less worrisome picture for the Fed on wages than the November report.” .”That being said, the Dollar Index, which measures the value of the dollar against a basket of rivals, fell below the 105,000 mark, spurred on by that Tweet, down 0.19%, to 104,963, a wind of tail for GBP/USD, which remains negative on the week at 1.38%, although on the day, posting minuscule gains of 0.13%.
Turning to US Treasury yields, the 10-year Treasury yield fell four basis points to 3.675%, while CME’s FedWatch tool shows the odds of a rise of 25 basis points at the February meeting are close to the 70% threshold.
The revisions to the average hourly earnings data paint a slightly less worrisome picture for the Fed on wages than reported in Nov.
The pick-up in wage growth in November (originally reported as +0.6%) was revised (to +0.4%).
Annual wage growth of 4.6% in December was the lowest since August 21 pic.twitter.com/1lCjoDjcMe
— Nick Timiraos (@NickTimiraos) January 6, 2023
GBP/USD reaction
In the GBP/USD 1 hour chart, the pair has jumped from 1.1850, with a strong recovery towards the 1.1920 signal. On its way north, it broke through the 20-EMA at 1.1906, although it remained slightly short of the daily pivot point around 1.1952. The Relative Strength Index (RSI) crossed above its midline of 50, while the Rate of Change (RoC) indicates buying pressure is mounting. Therefore, key GBP/USD resistance levels would be 1.1952, followed by the 100 EMA at 1.1979 and the 200 EMA at 1.2016.
As an alternate scenario, the first support level for GBP/USD would be the 20-EMA at 1.1906, above 1.1900, followed by today’s daily low at 1.1841.
Source: Fx Street
I am Joshua Winder, a senior-level journalist and editor at World Stock Market. I specialize in covering news related to the stock market and economic trends. With more than 8 years of experience in this field, I have become an expert in financial reporting.


