
- GBP/USD breaks key support levels and loses more than 1%.
- US headline inflation defies the Fed's intentions to cut rates and rises.
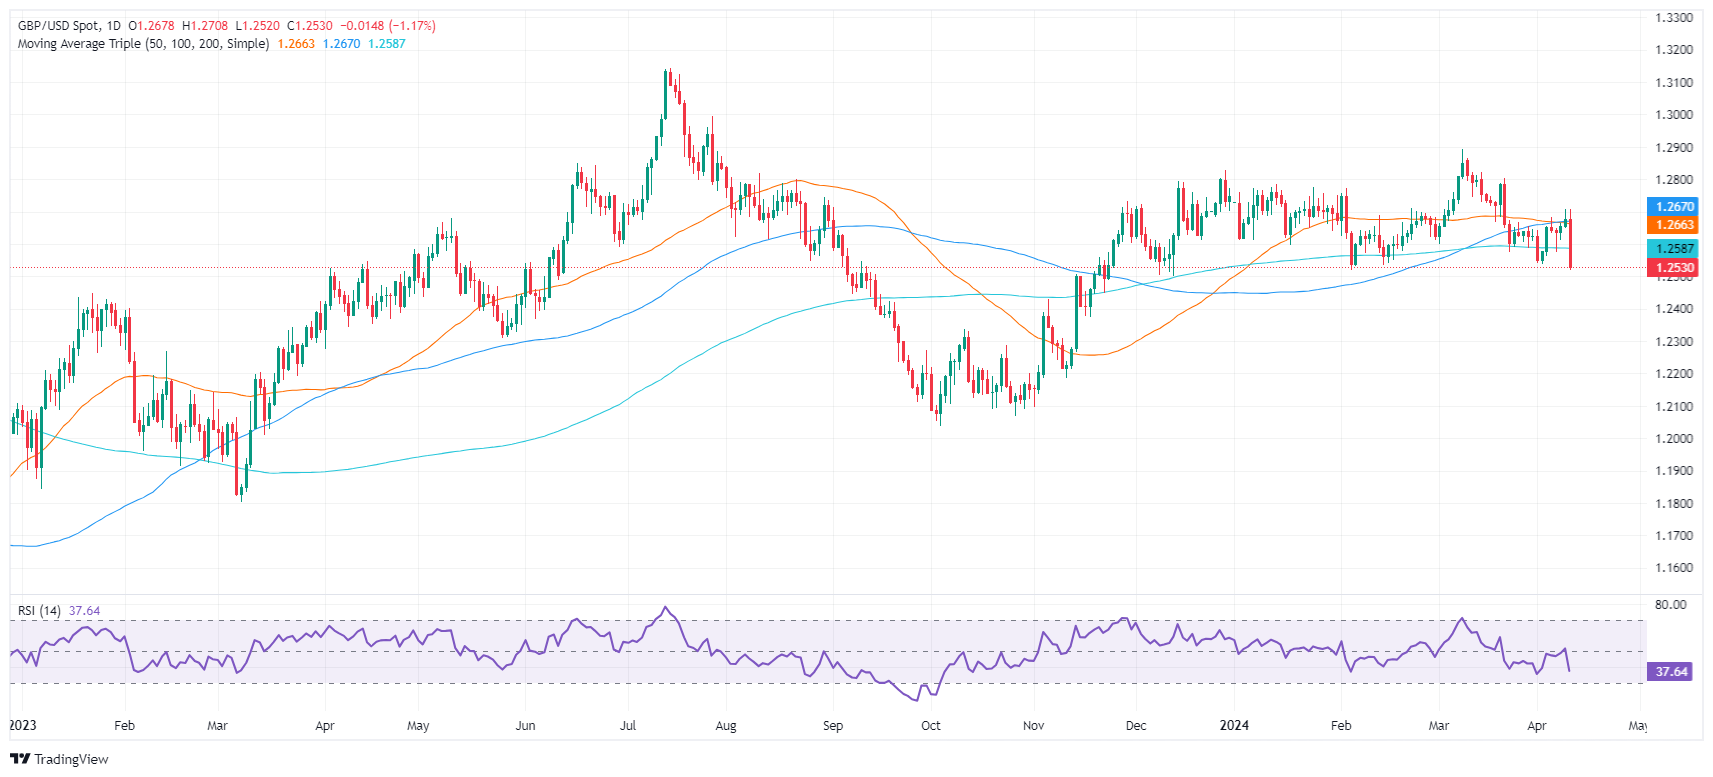
- The technical outlook suggests that GBP/USD will continue to fall.
The British Pound plummeted late on Wednesday during the North American session, losing more than 1% against the US Dollar, following the release of US inflation data. Expectations of a smaller rate cut by the US Federal Reserve caused a flight to the Dollar, which reached a new US annual high via the Dollar Index (DXY). GBP/USD is trading at 1.2534 after reaching a high of 1.2708.
The main declines occurred below 1.2600, followed by the 200 DMA
The highlight of the day was that inflation in the US remains higher than expected by the US central bank. The Consumer Price Index (CPI) rose 0.4% monthly and 3.5% annually, thus exceeding expectations. The core CPI also exceeded forecasts, maintaining a constant rate of 0.4% monthly and 3.8% annually, in line with February data.
This led investors to expect a less dovish Fed, as data from the Chicago Board of Trade (CBOT) shows. The December 2024 federal funds rate (FFR) contract suggests that market players estimate the FFR will end at 4.98%.
Recently, the latest minutes of the Federal Open Market Committee revealed that policymakers would like to be more confident that inflation continues to slow before committing to loosening policy. The minutes highlighted that almost everyone saw it as appropriate to cut this year, although most saw upward risks to inflation.
GBP/USD Price Analysis: Technical Outlook
The daily chart suggests that GBP/USD has moved from neutral to bearish bias, breaking key support levels such as the 200-day moving average (DMA) at 1.2585. Once surpassed, the next demand zone would be the figure of 1.2500. The next bearish zone is at 1.2448, the swing low of November 22, before 1.2400. In case of bullish recovery, 200 DMA is the first resistance, followed by 1.2600. Once GBP/USD is broken, the next resistance would be the 50-DMA at 1.2661.
Source: Fx Street
I am Joshua Winder, a senior-level journalist and editor at World Stock Market. I specialize in covering news related to the stock market and economic trends. With more than 8 years of experience in this field, I have become an expert in financial reporting.


