
- GBP/USD gains ground as technical indicators suggest a change in momentum for the pair.
- The Momentum indicator could confirm a weakening of the bearish bias once it breaks above the center line.
- The pair could find the immediate barrier at the upper boundary of the descending channel around the level of 1.2570.
GBP/USD extends its gains for the second consecutive session on Thursday, trading around 1.2530 during the Asian session. The pair is consolidating within the descending channel on the daily chart, with the 14-day Relative Strength Index (RSI) positioning at level 50. A new increase would indicate the weakening of a bearish bias.
Furthermore, the Moving Average Convergence Divergence (MACD) indicates a change in momentum as it sits above the signal line but below the center line. This momentum indicator could confirm the weakening of the downtrend once it breaks above the center line.
GBP/USD could test the immediate pullback support at the 1.2518 level, followed by the nine-day EMA at 1.2504 and the psychological level of 1.2500. A break below this level could pressure the pair to navigate the region around the six-month low of 1.2300, followed by the lower boundary of the descending channel around the 1.2240 level.
To the upside, immediate resistance appears at the upper boundary of the descending channel around 1.2570, followed by the 50% retracement level at 1.2597, drawn between the range of 1.2894 and 1. ,2300.
A break above the latter could support the GBP/USD pair to explore the area around the retracement resistance at the 1.2710 level.
GBP/USD: Daily Chart
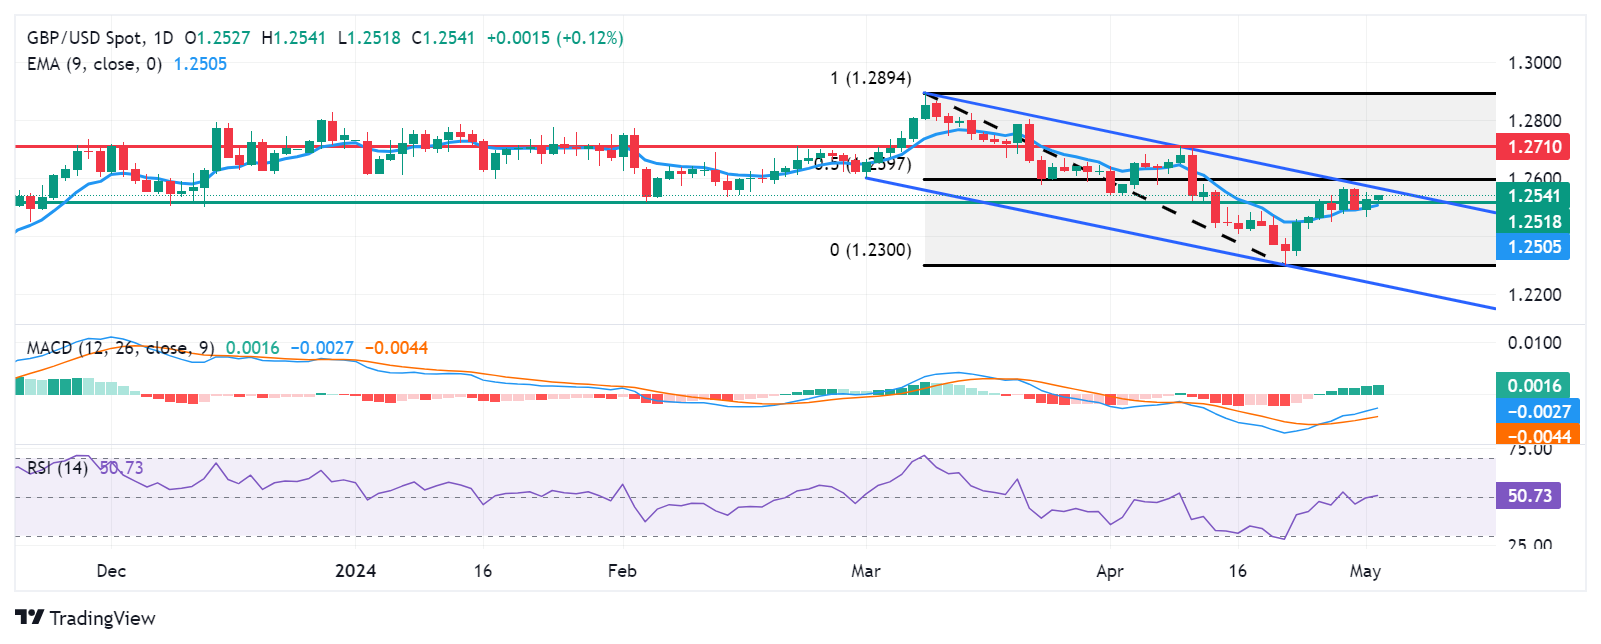
Source: Fx Street
I am Joshua Winder, a senior-level journalist and editor at World Stock Market. I specialize in covering news related to the stock market and economic trends. With more than 8 years of experience in this field, I have become an expert in financial reporting.


