
- GBP/USD remains near two-year lows due to risk aversion and UK growth woes.
- GBP/USD confirmed a breakout of the ascending triangle on the 4-hour chart on Wednesday.
- Bears brace for further decline towards pattern target of 1.2158.
The GBP/USD trades back below 1.2200 after a temporary pullback to near the 1.2230 area as disappointing UK GDP data continues to boost sterling bears.
The UK economy shrank 0.1% in March, while it expanded by only 0.8% quarter-on-quarter in the first quarter of 2022, which backs Bank of England forecasts of likely recession later this year.
Weak UK growth data combined with market risk aversion keep the downward pressure on the pair intact.
Investors brushed off upbeat comments from BOE Lieutenant Governor Dave Ramsden, who said that “the central bank is not talking bad about the economy in the forecasts“.
If we look at the GBP/USD 4-hour chart, Wednesday’s confirmation of an ascending triangle breakoutbelow the rising trend line support at 1.2310, has opened the doors for a test of the pattern target at 1.2158.
The RSI is entering the oversold territory around 30, which allows for more room to fall.
Should the aforementioned key support break, a test of the round level of 1.2100.
GBP/USD 4 hour chart
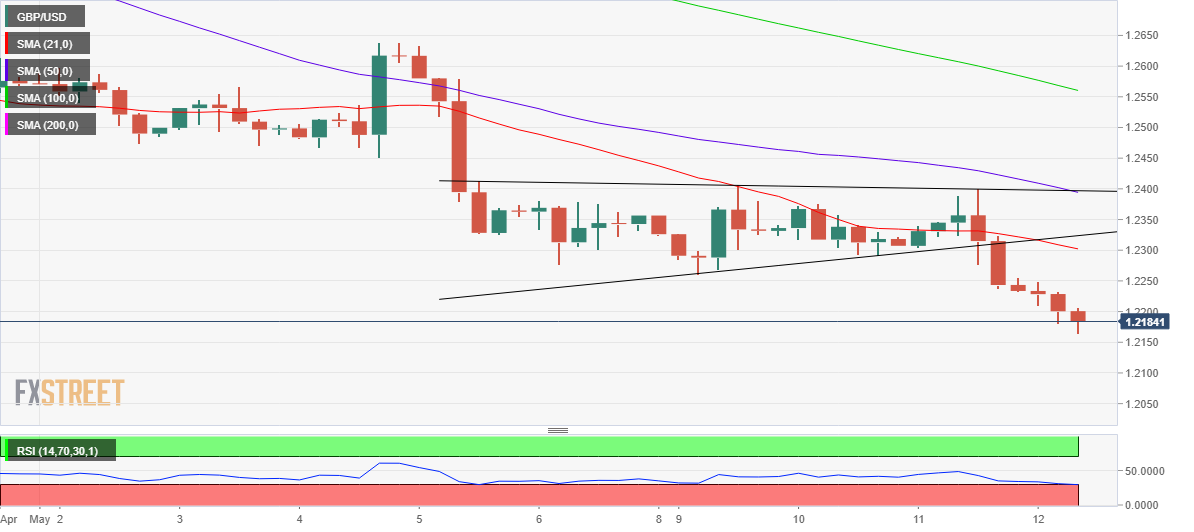
On the other hand, any recovery attempt must be accepted above daily highs of 1.2255.
The next upside target is seen at the downsloping 21-period simple moving average at 1.2302above which triangle support, now resistance, will come into play in 1.2323.
GBP/USD additional technical levels
Source: Fx Street
With 6 years of experience, I bring to the table captivating and informative writing in the world news category. My expertise covers a range of industries, including tourism, technology, forex and stocks. From brief social media posts to in-depth articles, I am dedicated to creating compelling content for various platforms.


