
- GBP/USD surpasses the 100 DMA, with buyers gaining traction.
- Buying interest remains strong as the RSI points higher, although it is not yet overbought.
- Key resistance lies at 1.2670, which would exacerbate followed by 1.2700.
- Sellers are targeting a close below the 100-DMA to challenge 1.2600.
The British pound gained 0.30% and hit a five-week high of 1.2670 following the release of the US Consumer Price Index (CPI). The data mostly coincided with the estimates, showing a continuation of the disinflation process, which weighed on the Dollar. The GBP/USD pair is trading at 1.2641 at the time of writing.
GBP/USD Price Analysis: Technical Insights
The GBP/USD pair maintains a neutral upward bias and hit a weekly high at 1.2670 following the weak US inflation report. However, the pair has retreated towards the 100-day moving average (DMA) at 1.2632, which is considered the next key technical level which, once breached, could pave the way for further gains.
The Relative Strength Index (RSI) shows that momentum favors buyers. The RSI is pointing up with enough margin before showing overbought conditions.
If buyers reclaim the 100-DMA, the next resistance would be today's high at 1.2670. A break of the latter would expose the April 9 high at 1.2709, before rising to the next supply zone at 1.2803, the March 21 high. Once passed, the next stop would be the yearly high at 1.2894.
On the contrary, sellers remain hopeful that the GBP/USD exchange rate will fall below the 100-DMA and achieve a daily close below that level, to challenge 1.2600. Once broken, the next stop would be the 50-DMA at 1.2591, followed by the 200-DMA at 1.2539.
GBP/USD Price Action – Daily Chart
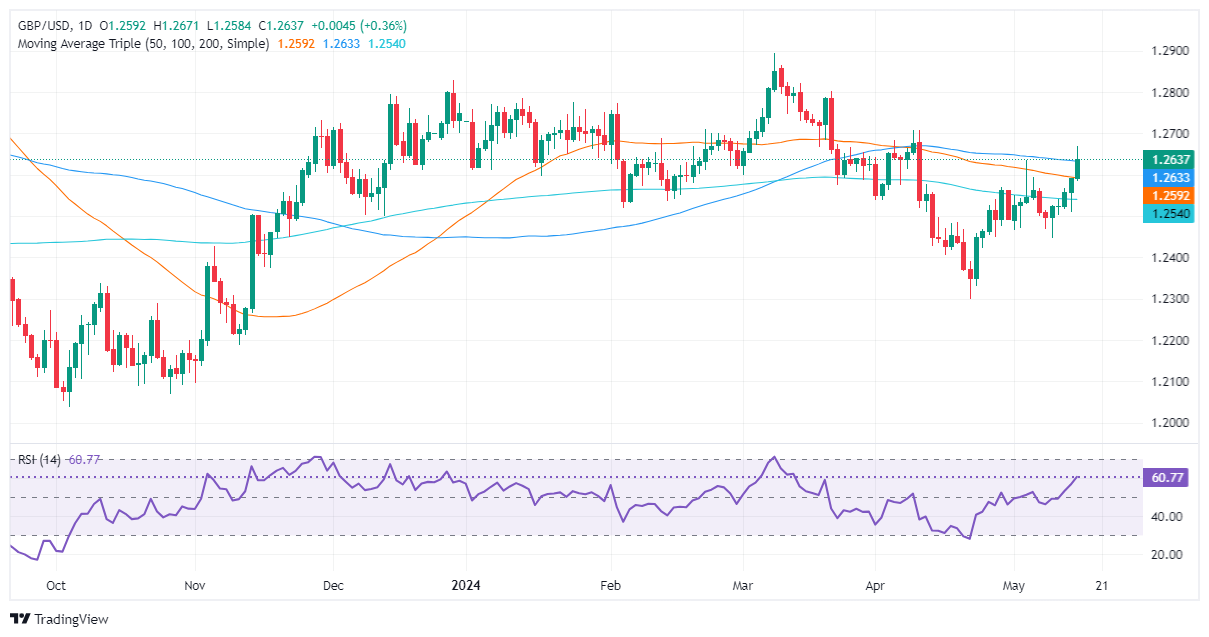
Source: Fx Street
I am Joshua Winder, a senior-level journalist and editor at World Stock Market. I specialize in covering news related to the stock market and economic trends. With more than 8 years of experience in this field, I have become an expert in financial reporting.


