
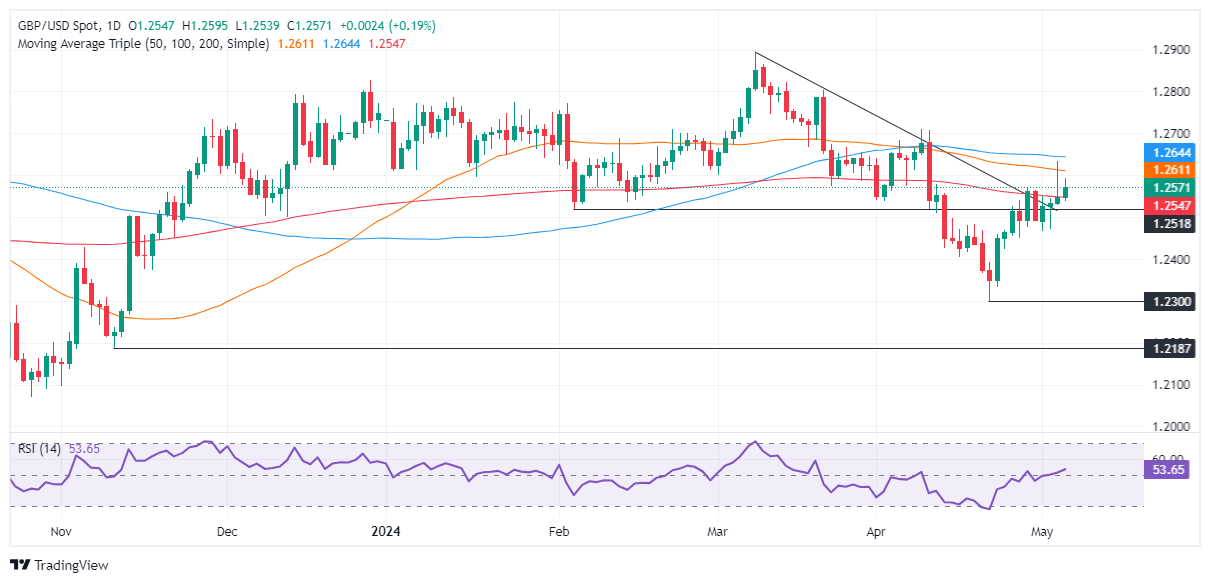
- GBP/USD is trading above the 200-DMA at 1.2547, buoyed by positive sentiment.
- The technical data suggests an uptrend, with resistance at the 50-DMA (1.2609) and the 100-DMA (1.2634/42).
- A drop below the 200-DMA could favor sellers, next supports at 1.2500 and the May 1 low at 1.2466.
During the North American session, the British Pound recorded slight gains against the US Dollar. The Bank of England (BoE) will decide monetary policy in a week. This and an optimistic market sentiment underpin the rise of GBP/USD, which is trading around 1.2579, above a key support level.
GBP/USD Price Analysis: Technical Insights
GBP/USD has a neutral to bullish short-term bias after breaking above the 200-day moving average (DMA) at 1.2547. From a momentum point of view, the RSI changed to the upside, which could open the door to challenge the 1.2600 level, slightly below the 50-DMA at 1.2609.
A break of the latter would expose the confluence of the May 3 high and the 100-DMA around 1.2634/42 before moving towards 1.2700.
On the other hand, if GBP/USD falls below the 200-DMA, sellers could regain control. First support would be 1.2500, followed by the May 1 low at 1.2466. Once broken, the next top would be 1.2400, followed by the April 22 low at 1.2299.
GBP/USD Price Action – Daily Chart
Source: Fx Street
I am Joshua Winder, a senior-level journalist and editor at World Stock Market. I specialize in covering news related to the stock market and economic trends. With more than 8 years of experience in this field, I have become an expert in financial reporting.
 that end online")


