
- GBP/USD reverses an intraday slide amid the appearance of strong selling around the dollar.
- Spot, prices lack bullish conviction and remain below a technically significant 200-day SMA.
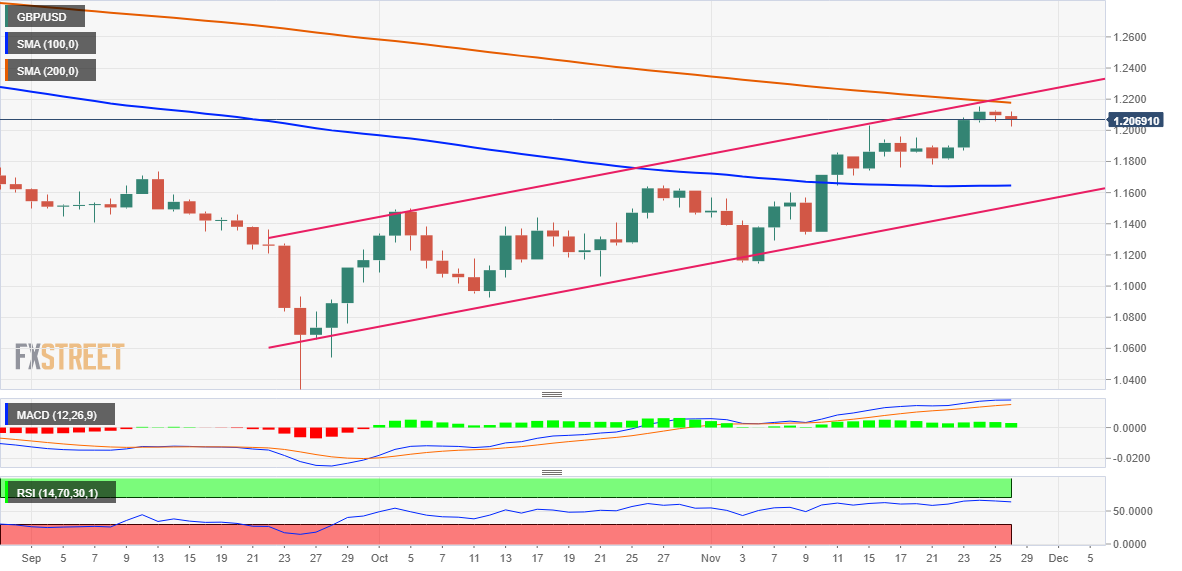
- This obstacle coincides with the resistance of the ascending channel and should act as a pivot point.
The pair GBP/USD it attracts some buying near the 1.2025 area on Monday, though it struggles to take advantage of the modest intraday rally. The pair has been bouncing between tepid gains and small losses throughout the early American session and now appears to have stabilized in neutral territory around the 1.2060 area.
The US dollar is coming under strong selling pressure amid increasing bets on a relatively minor Fed rate hike in December and turns out to be a key factor supporting GBP/USD. That being said, the risk-off state helps limit the fall in the safe-haven dollar. Apart from this, the bleak outlook for the UK economy helps limit significant gains for major currencies.
From a technical point of view, the pair has been trending up through an ascending channel for the past two months. The upper limit of said channel, currently around the 1.2170-1.2175 zone, coincides with the important 200-day SMA. This should act as a pivot point, which if broken decisively will be seen as a new trigger for bullish traders.
Meanwhile, the oscillators on the daily chart remain in positive territory and are still far from being in the overbought zone, which favors the bulls. That being said, it will still be prudent to wait for a convincing break through the confluence hurdle before positioning for any further rally towards the 1.2270-1.2275 resistance zone.
On the other hand, the lows around the 1.2025 zone could protect the immediate downside before the key psychological level of 1.2000. Any further dips are more likely to attract new buyers and get capped near the 1.1965 horizontal support. If these support levels are not defended, GBP/USD will be vulnerable to further weakening below 1.1900.
The corrective decline could drive the pair towards the next relevant support near the 1.1845-1.1840 region on the way to the 1.1800 level. A bit of trailing selling will expose the 1.1730 intermediate support, the 1.1700 round figure and the 100-day SMA, currently in the 1.1650-1.1640 zone.
GBP/USD daily chart
Key levels to watch
Source: Fx Street
I am Joshua Winder, a senior-level journalist and editor at World Stock Market. I specialize in covering news related to the stock market and economic trends. With more than 8 years of experience in this field, I have become an expert in financial reporting.


